
Blog
Software Testing Metrics - Types, Formula, Key Metrics, and Best Practices
.png)
Published on
October 8, 2025


Software testing metrics are quantifiable measures used to evaluate the effectiveness, efficiency, and quality of testing activities.
In modern software development, decisions are driven by data. But without the right metrics, quality assurance becomes guesswork. Software testing metrics transform subjective opinions into objective insights, giving QA teams, managers, and stakeholders the clarity they need to release with confidence.
Imagine releasing a product without knowing your defect density, test coverage, or automation ROI. You're flying blind. Testing metrics illuminate the path forward, revealing bottlenecks, measuring progress, and proving the value of your QA investments.
This comprehensive guide explores software testing metrics that matter. You'll discover which metrics to track, how to calculate them, real-world examples, and best practices for using metrics to drive continuous improvement. Whether you're a QA engineer optimizing test suites or a manager justifying automation spend, these metrics will transform how you measure and deliver quality.
Software testing metrics are quantifiable measures used to evaluate the effectiveness, efficiency, and quality of testing activities. They provide objective data about your testing process, test coverage, defect trends, and overall product quality.
Think of testing metrics as your quality dashboard. Just as a car's speedometer, fuel gauge, and engine temperature provide real-time feedback, testing metrics give you visibility into test execution speed, coverage completeness, and system health.
Key characteristics of effective testing metrics:
Software testing metrics answer critical questions like "Are we ready to release?" and "Is our automation delivering value?" Without metrics, you're relying on intuition. With metrics, you're making informed decisions backed by data.
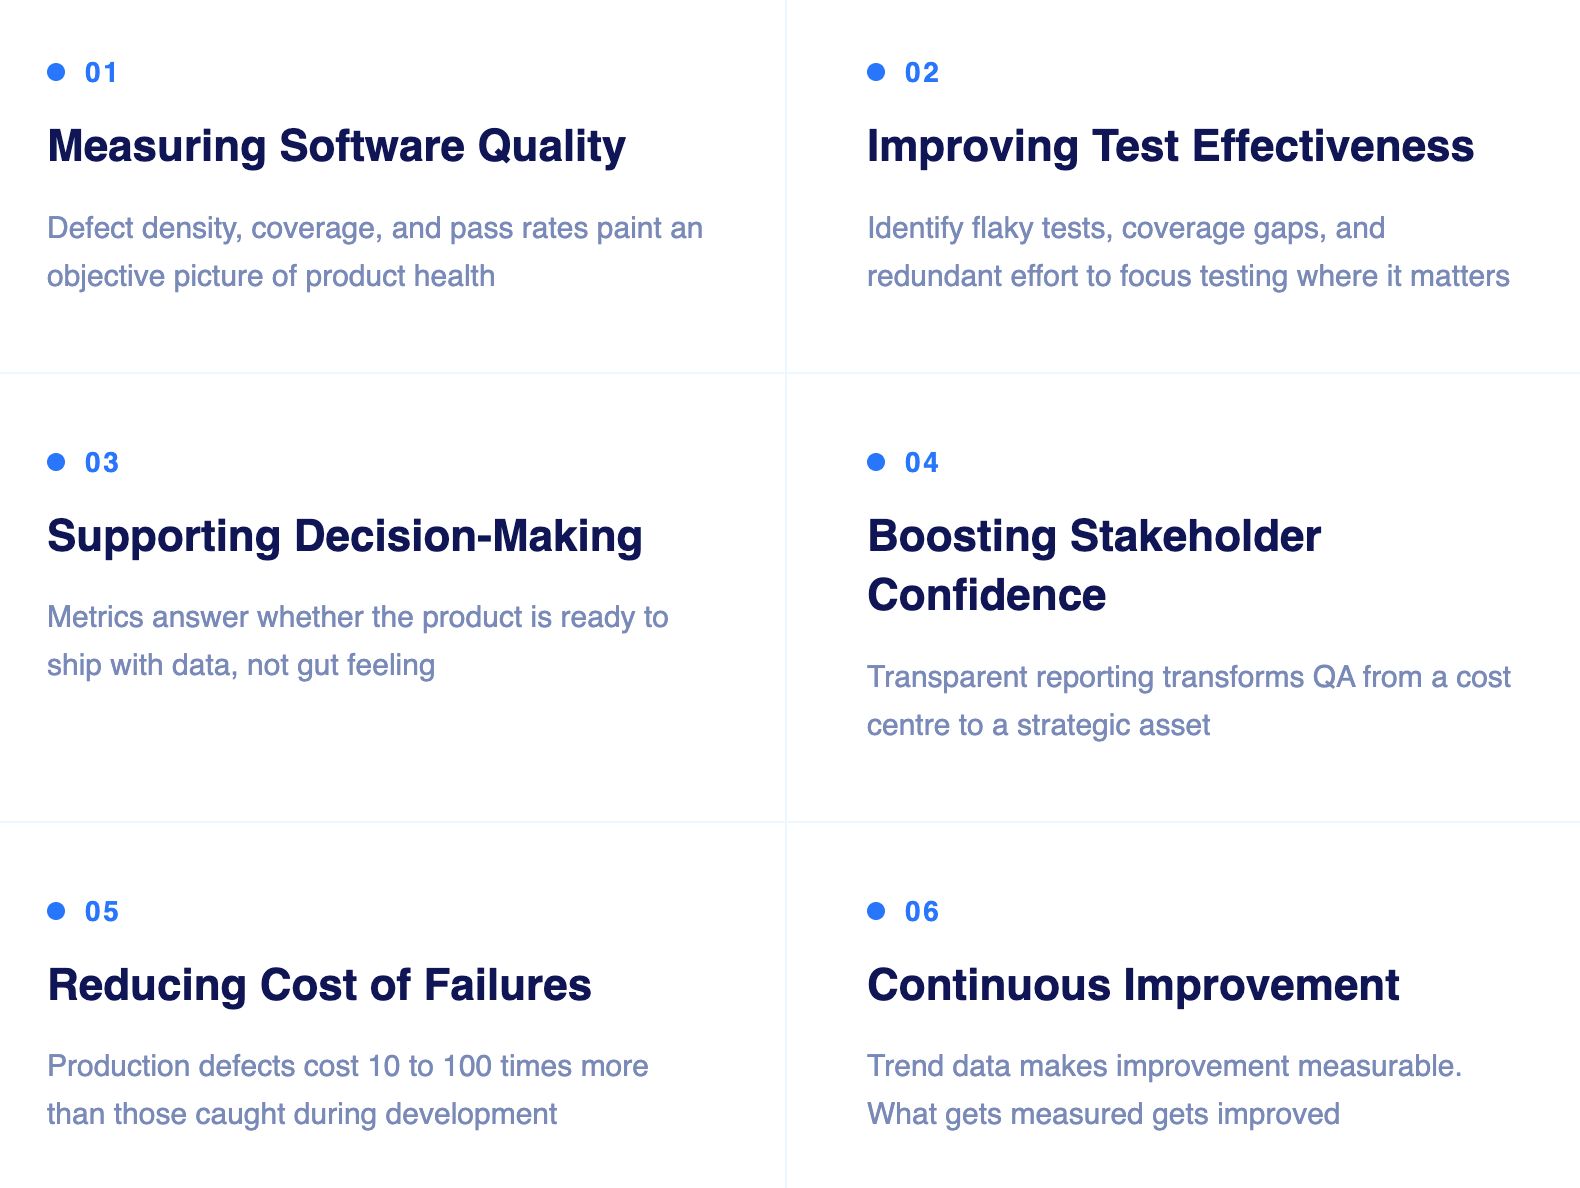
Metrics help evaluate the stability, reliability, and performance of your application. Defect density reveals code quality. Test coverage shows thoroughness. Pass rates indicate reliability. Together, these metrics paint a complete picture of software health.
Without metrics, quality discussions become subjective debates. With metrics, you have objective evidence of product readiness.
Testing metrics identify gaps, flaky tests, and redundant efforts. High flaky test rates signal unstable test environments or poor test design. Low automation coverage reveals areas needing attention. Defect leakage shows testing gaps.
By tracking these metrics, teams continuously refine their testing strategy, focusing effort where it matters most.
Metrics enable data-driven release decisions. When stakeholders ask "Are we ready to ship?" metrics provide the answer. High defect density suggests delaying release. Complete coverage with passing tests signals confidence. Test execution trends reveal velocity.
Decisions backed by metrics carry more weight than those based on gut feeling.
Transparent metrics build trust with leadership and customers. When executives see improving defect detection rates and increasing automation coverage, they understand the value QA delivers. Metrics transform testing from a cost center to a strategic asset.
Regular metric reporting keeps stakeholders informed and engaged.
Early defect detection prevents expensive production bugs. Metrics like Mean Time to Detect (MTTD) and Defect Removal Efficiency show how quickly teams catch issues. The earlier defects are found, the cheaper they are to fix.
Production defects cost 10-100x more than those caught in development. Metrics prove the ROI of thorough testing.
Metrics feed retrospectives and process optimization. Teams track metrics over time, identifying trends and patterns. Improving test productivity, reducing execution time, and increasing automation coverage become measurable goals.
What gets measured gets improved. Metrics make improvement tangible.
Test pass rates, defect severity trends, and open critical bugs answer this question. If 95% of tests pass and no P0/P1 defects remain, you're likely ready.
Defect detection efficiency, test coverage, and defect leakage reveal process effectiveness. High detection rates and low leakage indicate strong testing.
Related read: Explore the essential test automation KPIs every QA organization should report to measure effectiveness of test automation.
This metric shows the percentage of defects caught during testing versus production. A DDE above 90% is excellent.
Automation coverage, execution time reduction, and maintenance effort reveal ROI. If automation saves 100 hours monthly but requires 20 hours maintenance, the ROI is clear.
Defect density by module highlights problematic areas. Modules with 3x average defect density need attention.

Software testing metrics fall into three categories. Each answers a different set of questions about your testing programme.
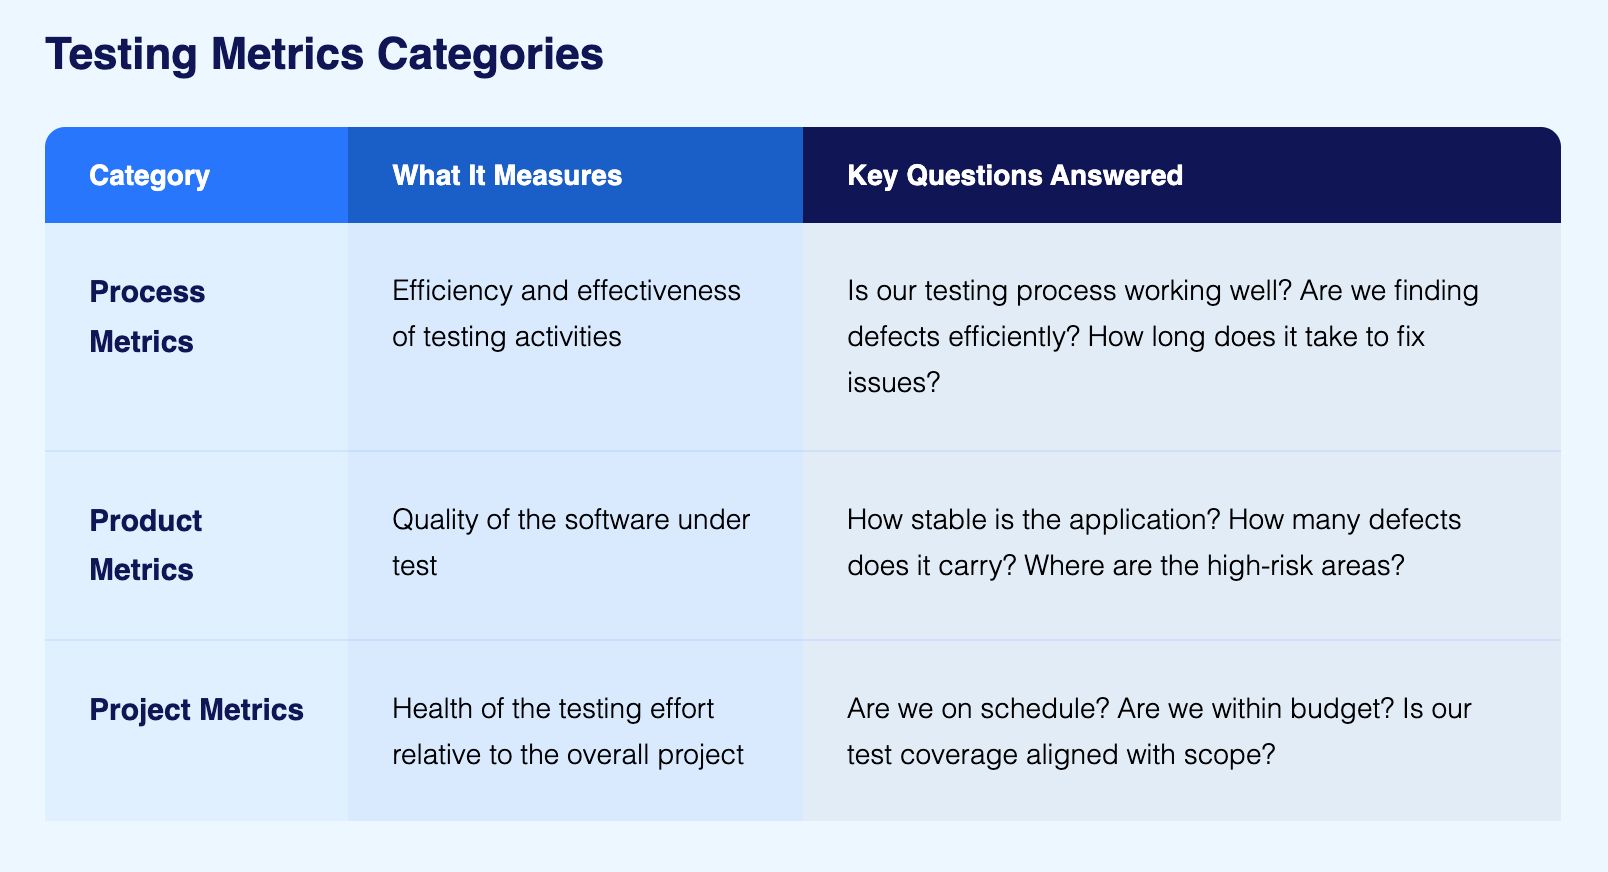
Process metrics measure the efficiency of QA processes. They evaluate how well your testing activities are executed.
Examples:
Process metrics help optimize workflows and reduce bottlenecks.
Product metrics measure the quality of the software itself. They evaluate the end product rather than the process.
Examples:
Product metrics reveal the health and stability of your application.
Project metrics measure overall project health. They provide a high-level view of testing progress and completion.
Examples:
Project metrics keep stakeholders informed on testing status.
Automation metrics track automation ROI, coverage, stability, and flakiness. They justify automation investments and identify improvement areas.
Examples:
Automation metrics prove the value of test automation initiatives.

Defect Density = Total Defects / Size of Module (KLOC, Function Points)
This metric measures defects per unit of code. A module with 50 defects across 10,000 lines of code (10 KLOC) has a density of 5 defects/KLOC.
Industry benchmarks:
High defect density indicates code complexity, inadequate testing, or poor development practices.
Defect Arrival Rate measures how quickly new defects are being reported during a given testing phase.
Defect Arrival Rate = New Defects Logged / Time Period
Example: If 60 defects are reported during a 10-day test cycle, the arrival rate is 6 defects per day.
A high arrival rate early in the test cycle is expected and healthy, it means testing is finding issues. A high arrival rate late in regression testing or immediately before release is a warning signal. It indicates the application is less stable than assumed and may not be ready to ship.
Track arrival rate trends across sprints rather than in isolation. A declining rate through the test cycle typically signals improving stability. A flat or rising rate signals the opposite.
DSI = (Σ (Defects × Severity Weight)) / Total Defects
This metric measures the overall severity impact of defects. Assign weights: Critical=10, High=5, Medium=3, Low=1.
Example: 5 Critical (50 points), 10 High (50 points), 20 Medium (60 points) = 160 points / 35 defects = DSI of 4.57 (indicates moderately severe issues)
DSI helps prioritize testing and development effort.
DRE = (Defects Removed / (Defects Removed + Escaped Defects)) × 100
This metric shows the percentage of defects caught before production. If QA finds 45 defects and 5 escape to production, DRE = (45 / 50) × 100 = 90%.
Target: >95% DRE indicates excellent testing effectiveness.
Low DRE suggests testing gaps or insufficient coverage.
Defect Leakage = (Defects Found in Production / Total Defects) × 100
This measures defects that escape testing and reach production. If 5 production defects occur among 50 total defects, leakage = 10%.
Goal: <5% defect leakage. High leakage damages user trust and increases costs.
Reopen Rate measures the percentage of defects that are marked as fixed but subsequently reopened because the fix was incomplete or the defect reappeared.
Reopen Rate = (Reopened Defects / Total Fixed Defects) × 100
Example: If 8 of 80 resolved defects are reopened, the reopen rate is 10%.
A high reopen rate reveals one of three systemic problems: incomplete root cause analysis leading to partial fixes, insufficient fix verification allowing inadequate solutions through, or environment differences between development and testing producing misleading results.
Execution Rate = (Executed Test Cases / Planned Test Cases) × 100
This tracks testing progress. If 80 of 100 planned tests execute, the rate is 80%.
Usage: Monitors testing velocity and identifies scheduling issues.
Pass Rate = (Passed Tests / Total Executed Tests) × 100
This reveals test stability. A pass rate of 95% means 95 of 100 tests succeed.
Target: >90% pass rate for stable releases. Lower rates indicate product instability.
Test Case Effectiveness measures how well your test cases are actually finding defects. A high pass rate with low test case effectiveness means tests are passing but not because the application is high quality, it is because the tests are not challenging the application sufficiently.
Test Case Effectiveness = (Defects Detected / Test Cases Run) × 100
Example: If 25 defects are found across 500 executed test cases, effectiveness is 5%. If 25 defects are found across 100 test cases, effectiveness is 25%.
Higher effectiveness indicates tests are targeting real problem areas rather than validating already-stable functionality. Teams focused purely on increasing test count without measuring effectiveness often build large suites that provide false confidence.
Productivity = Number of Test Cases Designed / Effort (Person-Hours)
This measures test design efficiency. Creating 50 test cases in 10 hours yields productivity of 5 test cases/hour.
Usage: Benchmarks team performance and identifies training needs.
Test Coverage = (Requirements Covered / Total Requirements) × 100
This ensures all requirements have tests. With 80 of 100 requirements tested, coverage = 80%.
Goal: 100% requirement coverage before release. Gaps represent risk.
Code Coverage = (Lines of Code Executed / Total Lines of Code) × 100
This measures code tested by automated tests. If tests execute 7,000 of 10,000 lines, coverage = 70%.
Benchmarks:
High coverage doesn't guarantee quality, but low coverage guarantees gaps.
This qualitative metric assesses whether high-risk areas receive adequate testing attention. Critical payment flows, security features, and data integrity checks need thorough coverage.
Best practice: Use risk-based testing to prioritize coverage where failures hurt most.
Effort Variance = Actual Effort - Planned Effort
This measures estimation accuracy. If testing takes 120 hours vs 100 planned, variance = +20 hours (20% over).
Usage: Improves future estimation and reveals scope creep.
Cost per Defect = Total Testing Cost / Total Number of Defects Found
This calculates testing efficiency. Spending $50,000 to find 200 defects = $250/defect.
Application: Justifies testing investments and optimizes resource allocation.
ROI = (Manual Testing Cost – Automated Testing Cost) / Automated Testing Cost × 100
This proves automation value. If manual testing costs $100,000 and automation costs $30,000 with $20,000 in avoided manual costs, ROI = 350%.
Target: Positive ROI within 6-12 months of automation investment.
Automation Coverage = (Number of Automated Test Cases / Total Test Cases) × 100
This tracks automation adoption. With 150 automated tests among 200 total, coverage = 75%.
Industry targets:
Focus automation on stable, repetitive, high-value tests.
Maintenance Effort = Hours Spent Updating Tests / Total Test Automation Hours
This reveals automation overhead. Spending 10 hours monthly maintaining tests that run in 2 hours = high maintenance burden.
Goal: <20% of automation time spent on maintenance. High maintenance suggests brittle tests or poor framework design.
Flaky Test Rate = (Number of Flaky Tests / Total Automated Tests) × 100
This measures test reliability. If 5 of 100 tests fail intermittently, flaky rate = 5%.
Target: <2% flaky rate. Flaky tests erode confidence and waste debugging time.
ROI = (Manual Testing Cost – Automated Testing Cost) / Automated Testing Cost × 100
This justifies automation investments through time and cost savings.
Example: Manual regression takes 40 hours/sprint at $50/hour = $2,000. Automated regression takes 2 hours at $50/hour = $100. Monthly savings = $7,800. If automation costs $30,000, ROI achieved in 4 months.

.jpg)
Start by identifying what you want to measure and why, and align those goals with your broader test automation strategy. Are you improving defect detection? Reducing test time? Proving automation ROI? Clear objectives guide metric selection.
Choose metrics that directly support your objectives. Don't track metrics because you can measure them. Track metrics because they drive decisions.
Prioritize:
Implement automated data collection wherever possible. Test management tools, CI/CD systems, and defect trackers capture most metrics automatically.
Best practices:
Look for trends, patterns, and anomalies. A single metric value means little. Trends over time reveal insights. Compare metrics against baselines and benchmarks.
Ask:
Related Read: What is Baseline Testing? Definition, Types, and Best Practices
Metrics without action waste effort. Use insights to drive specific improvements. High defect density? Increase code reviews. Low automation coverage? Prioritize test automation. High flaky rate? Stabilize test environments.
Track whether actions improve metrics.
As projects evolve, metrics must adapt. Quarterly reviews ensure metrics remain relevant. Retire metrics that no longer drive decisions. Add metrics for emerging priorities.
Metrics are tools, not goals. Focus on outcomes, not numbers.
Choose a metric aligned with your objectives. Need to measure testing thoroughness? Use requirement coverage or code coverage. Want to track defect trends? Use defect density or leakage rate.
Gather the inputs needed for calculation. Most data comes from test management systems, defect tracking tools, and CI/CD platforms.
Common data sources:
Calculate the metric using the appropriate formula. Consistency matters. Calculate metrics the same way every time for accurate trending.
Context gives metrics meaning. A 70% pass rate could be excellent for early testing or concerning for release candidates. Compare against:
Visualize metrics in clear, actionable formats. Dashboards show current status at a glance. Trend charts reveal progress over time. Color-coded indicators (red/yellow/green) highlight areas needing attention.
Effective presentations:
Defect Density = Total Defects / Size of Module (KLOC, Function Points)
Example: A banking module has 30 defects across 5,000 lines of code (5 KLOC). Defect Density = 30 / 5 = 6 defects per KLOC
This indicates the module needs quality improvement as it exceeds good benchmarks (1-3 defects/KLOC).
DRE = (Defects Removed / (Defects Removed + Escaped Defects)) × 100
Example: QA finds 85 defects during testing. 5 defects escape to production. DRE = (85 / (85 + 5)) × 100 = (85 / 90) × 100 = 94.4%
This excellent DRE shows effective testing catches most issues before release.
Test Coverage = (Requirements Covered / Total Requirements) × 100
Example: An e-commerce platform has 120 requirements. Tests cover 102 of them. Test Coverage = (102 / 120) × 100 = 85%
The remaining 15% represents risk. Prioritize tests for uncovered requirements.
Execution Rate = (Executed Test Cases / Planned Test Cases) × 100
Example: Sprint plan includes 200 test cases. Team executes 175. Execution Rate = (175 / 200) × 100 = 87.5%
This shows good progress, but 25 unexecuted tests need attention before release.
Defect Leakage = (Defects Found in Production / Total Defects) × 100
Example: Total defects = 120 (100 in testing + 20 in production). Defect Leakage = (20 / 120) × 100 = 16.7%
This high leakage suggests testing gaps. Strengthen test coverage and regression suites.
DSI = (Σ (Defects × Severity Weight)) / Total Defects
Assign severity weights: Critical=10, High=5, Medium=3, Low=1.
Example:
Total: 139 points / 50 defects = DSI of 2.78
This moderate DSI suggests manageable defect severity. Focus effort on the 11 critical/high issues.
Rejection Ratio = (Rejected Defects / Total Reported Defects) × 100
Example: QA reports 150 defects. Developers reject 15 as "not a defect" or duplicates. Rejection Ratio = (15 / 150) × 100 = 10%
High rejection ratios indicate unclear defect criteria or poor communication between QA and development.
MTTD = Total Time Taken to Detect Defects / Total Number of Defects
Example: Team detects 40 defects over 160 hours of testing. MTTD = 160 / 40 = 4 hours per defect
Lower MTTD indicates efficient testing. Track MTTD trends to measure testing effectiveness improvements.
MTTR = Total Time to Fix Defects / Total Number of Defects
Example: Developers spend 120 hours fixing 30 defects. MTTR = 120 / 30 = 4 hours per defect
Lower MTTR indicates efficient development processes. High MTTR for simple bugs suggests inefficiencies.
Cost per Defect = Total Testing Cost / Total Number of Defects Found
Example: Testing costs $75,000. Team finds 150 defects. Cost per Defect = $75,000 / 150 = $500 per defect
Compare against industry benchmarks and production defect costs to justify testing investments.
Automation Coverage = (Number of Automated Test Cases / Total Test Cases) × 100
Example: 180 automated tests among 250 total test cases. Automation Coverage = (180 / 250) × 100 = 72%
Strong automation coverage, but 70 manual tests remain. Evaluate which should be automated vs kept manual.
ROI = (Manual Testing Cost – Automated Testing Cost) / Automated Testing Cost × 100
Example:
Annual savings = $36,000 - $3,600 = $32,400 ROI = ($32,400 / $25,000) × 100 = 129.6% annually
Automation pays for itself in <10 months, then delivers ongoing savings.
Productivity = Number of Test Cases Designed / Effort (Person-Hours)
Example: QA engineer creates 45 test cases in 15 hours. Productivity = 45 / 15 = 3 test cases per hour
Track productivity trends to identify training needs and process improvements.

A loan processing module contains 8 KLOC (8,000 lines of code). During testing, QA discovers 24 defects.
Calculation: Defect Density = 24 defects / 8 KLOC = 3 defects per KLOC
Analysis: This falls within the "good" range (1-3 defects/KLOC) but approaches the upper limit. The module needs monitoring. If defect density increases in future sprints, investigate code quality and testing thoroughness.
An online store has 150 functional requirements. The test suite covers 135 of them with documented test cases.
Calculation: Test Coverage = (135 / 150) × 100 = 90%
Analysis: Strong coverage, but 15 requirements lack tests. These uncovered requirements represent release risk. Prioritize test creation for the 10% gap before launch.
During a release cycle, testing catches 92 defects. Post-release, customers report 8 additional defects.
Calculation: Total defects = 92 + 8 = 100 DRE = (92 / 100) × 100 = 92%
Analysis: Good DRE, but room for improvement. Industry leaders achieve 95%+ DRE. Analyze the 8 escaped defects. Were they in untested areas? Edge cases? Use this analysis to strengthen testing.
Effective metrics follow the SMART framework:
Specific: "Improve test coverage" is vague. "Increase API test coverage from 70% to 85%" is specific.
Measurable: Quantify the metric. Use percentages, counts, or time-based measures.
Achievable: Set realistic targets. Don't aim for 100% automation if your application changes daily.
Relevant: Align metrics with business goals. Track what matters to stakeholders.
Time-bound: Define when to achieve the target. "Reach 85% coverage by Q3 end" creates urgency.
Choose metrics that support organizational objectives. If rapid releases drive business value, track CI/CD test execution time. If customer satisfaction is priority, monitor production defect rates.
Metrics disconnected from business goals won't get attention or resources.
Avoid metrics that incentivize wrong behaviors. Tracking test cases created might encourage quantity over quality. Measuring developers by defect counts creates blame culture.
Balance efficiency metrics (execution time) with quality metrics (defect detection rate).
Some metrics look impressive but provide no actionable insights. Total test cases executed sounds good but reveals nothing without context. What matters is coverage of critical paths, not total volume.
Focus on metrics that drive decisions, not those that look good in presentations.
Every metric should answer "What should we do differently?" If a metric doesn't inform action, stop tracking it.
Good metric: Defect leakage is 12% (Action: Strengthen regression testing)
Vanity metric: We ran 10,000 tests (Action: None clear)
Metrics without context mislead. A 95% pass rate might indicate quality or might reflect inadequate test depth. Low defect counts could mean excellent quality or insufficient testing.
Always interpret metrics within context. Combine quantitative metrics with qualitative insights.
Poor logging or inconsistent reporting undermines metric reliability. If defect severity varies by reporter, severity metrics become meaningless. If testers forget to log hours, effort metrics fail.
Invest in consistent data collection processes and tool integration.
Information overload paralyzes decision-making. Tracking 50 metrics means tracking none effectively. Focus spreads too thin. Critical signals drown in noise.
Identify 5-7 key metrics for regular review. Use others for deep dives when needed.
Not everything valuable is measurable. User experience, exploratory testing insights, and team morale impact quality but resist quantification.
Balance metrics with qualitative feedback from testing, user research, and team retrospectives.
Metrics can feel like micromanagement. If teams believe metrics judge them personally rather than improve processes, resistance follows.
Frame metrics as process improvement tools, not performance evaluation weapons. Focus on trends, not individual performance.
Related read: See how Predictive Intelligence is transforming test metrics by turning reactive tracking into proactive, risk-based insights.
Mix process, product, and automation metrics for comprehensive visibility. Don't focus solely on defects while ignoring test coverage. Balance leading indicators (coverage, test design productivity) with lagging indicators (defect leakage).
A balanced scorecard prevents blind spots.
CI/CD integration enables real-time dashboards. Modern tools automatically capture execution results, defect data, and coverage metrics. Automated collection ensures consistency and saves manual effort.
If you're manually compiling metrics, you're wasting time and introducing errors.
Retrospectives should analyze metric trends. Monthly or quarterly reviews identify patterns. What improved? What declined? What surprised us? Use these insights to refine testing strategy.
Metrics without review are data collection theater.
Share metrics with all stakeholders to build accountability. Visible metrics create shared understanding of quality status. Developers see test coverage gaps. Managers see automation ROI. Leadership sees release readiness.
Transparency drives collective ownership of quality.
Encourage a culture of learning, not punishment. When defects escape, analyze why testing missed them. Don't blame testers. Improve test design, expand coverage, or adjust test strategy.
Blame culture makes teams hide problems. Learning culture makes teams solve them.
Related read: Review the common challenges of test automation and how to overcome them, since issues like flaky tests, brittle scripts, and unstable environments can distort your metrics and create a blame culture.

Metric overload creates analysis paralysis. Hundreds of metrics mean nothing matters. Leaders can't remember what to watch. Teams don't know what's important.
Ruthlessly prioritize. Track what drives decisions. Archive the rest.
Yesterday's metrics may not fit today's priorities. Early projects need development velocity metrics. Mature products need stability metrics. Changing contexts require changing measurements.
Quarterly metric reviews keep measurements relevant.
Automation metrics tell part of the story. High automation coverage with poor test design delivers false confidence. Low flaky rates mean nothing if tests don't catch defects.
Balance automation metrics with defect detection and coverage metrics.
Volume metrics encourage wrong behaviors. Tracking "test cases executed" might inflate numbers with redundant tests. Measuring "defects found" might encourage logging trivial issues.
Focus on test effectiveness, not test quantity.
Virtuoso QA transforms testing metrics from data collection burden into strategic advantage. As a no-code, AI-powered test automation platform, Virtuoso automatically captures comprehensive metrics throughout your testing lifecycle.
Virtuoso eliminates manual metric tracking. Every test execution generates rich data: execution time, pass/fail status, failure patterns, and root causes. AI-powered Root Cause Analysis accelerates defect understanding, improving MTTR metrics automatically.
Virtuoso's reporting dashboards provide instant visibility into test coverage, execution trends, and quality metrics. Stakeholders see test progress in real-time, not days later after manual compilation.
Virtuoso's AI-powered self-healing capabilities automatically reduce flaky test rates. When UI elements change, tests adapt automatically, improving test stability metrics without manual maintenance.
Natural Language Programming and AI Authoring accelerate test creation, improving test case productivity metrics. Teams author tests 75% faster, expanding coverage without expanding timelines.


Try Virtuoso QA in Action
See how Virtuoso QA transforms plain English into fully executable tests within seconds.