Blog
Introducing Analytics 2.0 — Reporting Add-on for Virtuoso QA

Temitope Adeosun
Published on

Table of contents
Lorem ipsum
Lorem ipsum
Lorem ipsum
Lorem ipsum
Lorem ipsum
Reporting can be a big hassle - keeping your pulse on key metrics surrounding your tests, debugging recurring failed tests, studying execution times for different projects at the same time, and so on.
For months, we’ve been listening to your feedback about the late nights spent compiling reports from different screens or experiencing difficulty in getting a holistic view of your testing progress and making data-driven decisions. These frustrations have not gone under the radar. We knew there had to be a better way.
And now, there is.
The wait is over.
Now, you can have all your test data at your fingertips, accessible in real-time, easy to interpret, and even easier to share.
In this release, we’re thrilled to announce the launch of our all-new and powerful add-on for your reporting. This paid add-on will be fully integrated and serve as a centralized solution that brings all your data together, so you can focus on making informed decisions faster and your testing smarter.
To get you started, we’ve made a free limited version of Analytics 2.0 available to everyone. This version includes a few essential charts and offers access to seven days of data history—perfect for experiencing the powerful insights now within reach. To explore it, simply click on the Analytics tab in your Virtuoso QA Project dashboard. However, the paid add-on unlocks the full experience, including all charts and a full year of data history.
Let’s break down what’s inside.
Real-Time Insights: No More Waiting for Data
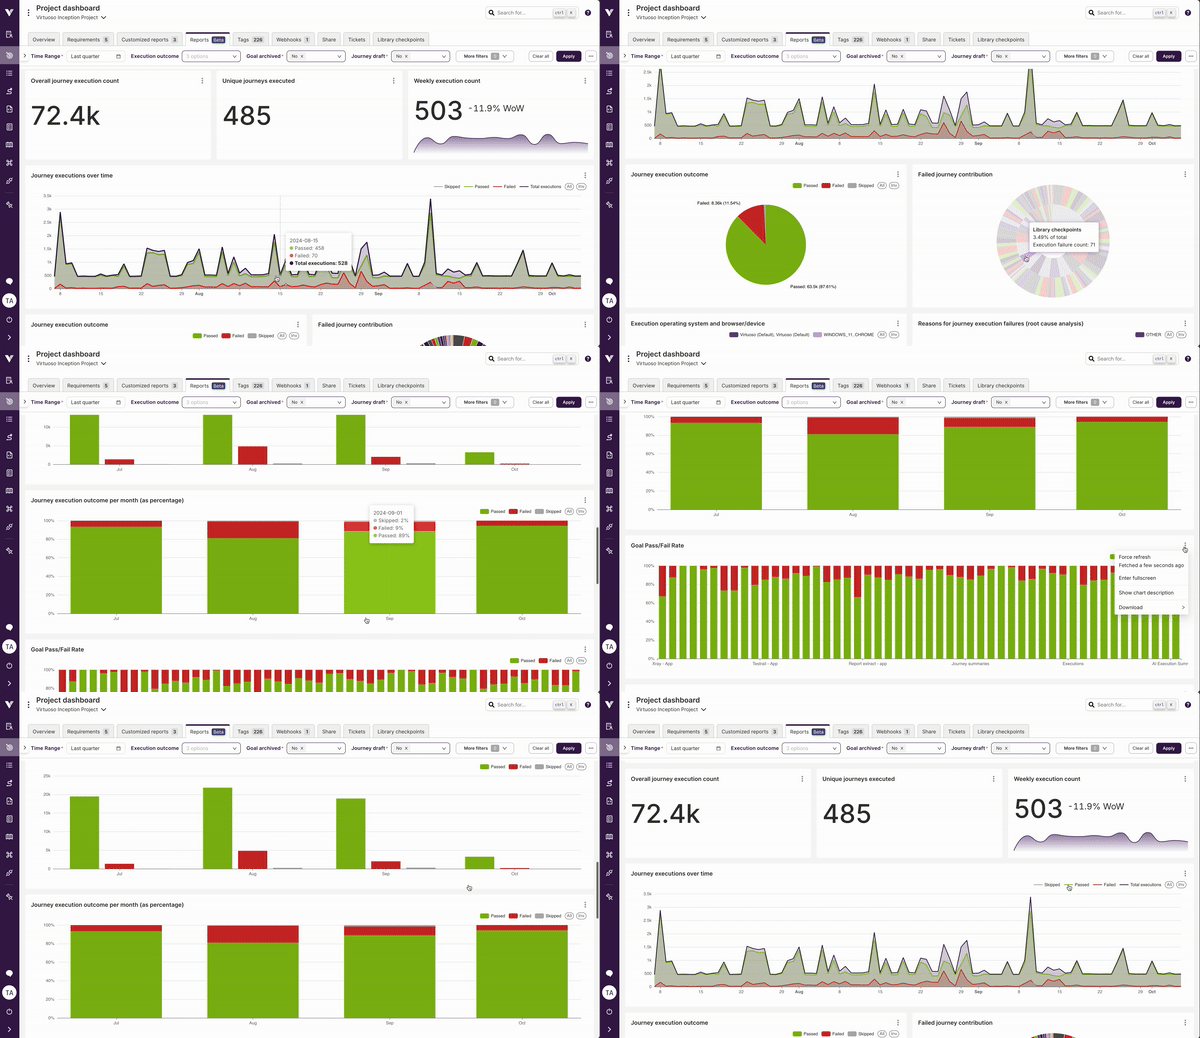
Get the clarity you need—instantly. With Analytics 2.0, your test results are available in real time. You can:
Monitor test execution live reports in simple-to-understand charts and figures.
Spot failures immediately and act on them before they become major issues.
View real-time trends that help you make faster, smarter decisions.
Say goodbye to long waiting periods for reports to be generated. Gain fast access to all key figures and charts like your Overall journey execution, Unique journeys executed, Failed journey contribution, Reasons for journey execution failures (root cause analysis), Goal Pass/Fail Rate, Goals summary and many more.
Effortless, Intuitive Reporting
We’ve streamlined the reporting process so you can focus on what matters:
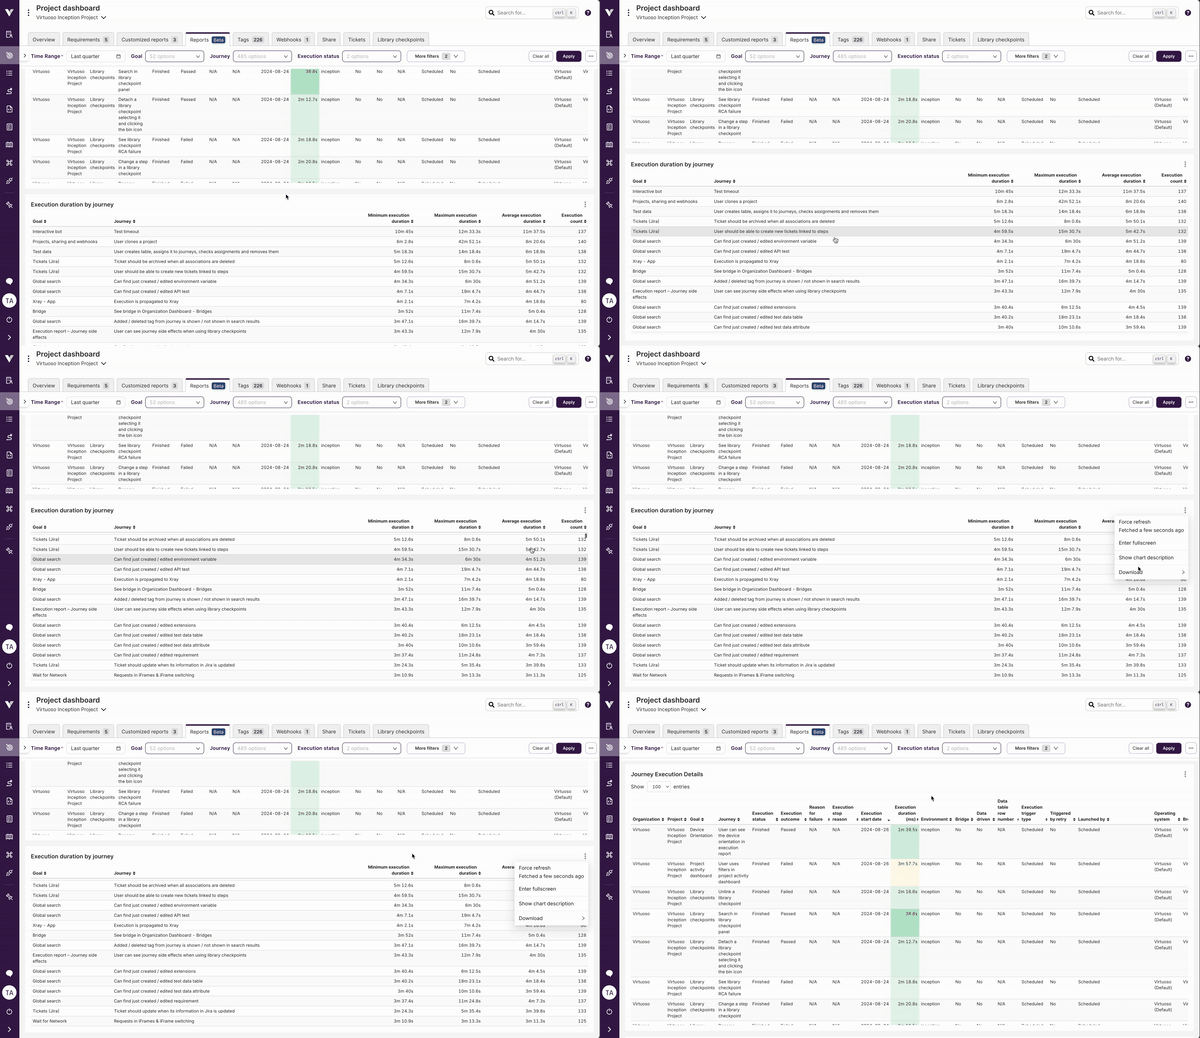
Export reports in PDFs, CSV, Excel, or beautifully formatted images.
Share insights with your team, free of formatting hassles.
Generate detailed reports in just a few clicks. No more hours lost to manual data compilation.
Your weekends are officially yours again.
Tailored Insights for Every Role
Whether you’re a QA Tester, QA Lead, or Senior Manager, Analytics 2.0 delivers the data that matters most to you.
For QA Testers:
Track performance, identify bugs quickly, and stay on top of which tests need attention.For QA Leads:
Get a bird’s-eye view of trends, guide your team with data-backed insights, and optimise your testing process.For Senior Managers:
Access high-level metrics to make confident, data-driven decisions that impress in every meeting.
Ready to upgrade?
Want to see how Analytics 2.0 can help you unlock real-time insights and smarter reporting? Click the link below to request an upgrade, and our team will help you get started.
For a deeper dive:
Watch the walkthrough video for a guided tour of Analytics 2.0
Check the full documentation for step-by-step instructions
View the changelog for details on what’s new
Stay tuned for future updates from Virtuoso QA. Happy testing!