

Blog
What is Test Coverage and Which Metrics Matter

Published on
July 30, 2026


Test coverage measures how thoroughly a defined aspect of the system has been tested, expressed as the percentage of that aspect the tests have reached.
Coverage is one of the most quoted and least understood numbers in software testing. It gets read out in stand-ups, plotted on dashboards, defended in budget reviews, and leaned on to justify shipping. Most of the time, the people quoting it have not agreed on which coverage they are measuring or what the number is meant to tell them.
Picture a team reporting "80% coverage." That could mean 80% of executable lines were run by the tests, or 80% of requirements have a test mapped to them, or 80% of critical journeys have end-to-end automation, or none of those exactly, because the team never separated the ideas. The number sounds precise and means almost nothing until you say what it is a percentage of.
What follows treats coverage the way it should be used now, namely as three distinct layers, structural, specification, and behavioural. Each commonly quoted metric is defined with its formula and its limits, the anti-patterns that make coverage misleading rather than useful are called out, and the shift that AI-assisted development has forced on what coverage even measures is spelled out at the end.
Test coverage is the proportion of something the tests have exercised, measured against some defined whole. The "something" varies and the "whole" varies, and the proportion only means anything once both are pinned down.
A working definition is that test coverage measures how thoroughly a defined aspect of the system has been tested, expressed as the percentage of that aspect the tests have reached. The aspect might be code, requirements, features, journeys, risks, or configurations, in fact anything about the system you can enumerate.
The trap is quoting the proportion without naming the aspect. "We have 80% coverage" is not a statement anyone can act on until you know 80% of what. Half the confusion in coverage conversations comes from two people using the same number to mean different things and never noticing.
Coverage earns its keep because it makes the invisible visible. Without it, a testing programme runs on gut feel about whether enough has been done, and with it the team at least has something concrete to argue over.
The problem is that the number misleads the moment it gets treated as a single dimension or as a stand-in for quality, and there are four ways that goes wrong.
When a measure becomes a target it stops being a good measure. Tell a team to hit 100% line coverage and they will, and the suite that results will tell you nothing about whether the app works, because the tests were written to touch lines rather than to check behaviour.
A team that reports only code coverage is blind to everything code coverage cannot see, namely integration failures, workflow defects, and user-experience problems. It can wave a 95% number and still ship a release that breaks in production.
Coverage that does not track risk is vanity. A suite that thoroughly covers low-value features and skips the high-risk journeys posts a big number and delivers little safety.
Code coverage records what the tests ran, not what they proved. A test that calls a function without asserting anything meaningful lifts the number and adds nothing to confidence.
None of this is an argument for dropping coverage. It is an argument for measuring it at the right layers, using several metrics together, and never letting one number stand in for the answer to "is this release ready."

Coverage works at three layers, and each answers a different question. A programme that measures only one of them is confident about one thing and blind to the other two, so mature programmes measure at all three and keep them clearly apart.

Measure only at the structural layer and you can see the code but not the outcomes. Measure only at the behavioural layer and you can see the outcomes but cannot diagnose where the structural gaps are. The point is not to pick one, it is to know which layer answers which question.
Structural metrics measure what the tests exercised in the code itself. They are well defined, well tooled, and mostly used by developers, and they run from coarse to rigorous.
The share of executable statements the tests ran, namely (statements executed / total executable statements) × 100.
It is the most common metric, easy to measure and easy to game, and hitting 100% does not mean every logical condition was tested.
The share of executable lines the tests ran, namely (lines executed / total executable lines) × 100.
Close to statement coverage and often used interchangeably, though they differ where several statements share a line or one statement spans several lines.
The share of decision branches exercised, namely (branches executed / total branches) × 100.
More rigorous than statement coverage, since a suite at 100% statement coverage can sit at 60% branch coverage when the same statement is reached without exercising every path into it.
The share of boolean sub-expressions evaluated both true and false, namely (conditions evaluated both ways / total conditions) × 100.
It matters most in compound logical expressions, where full branch coverage can still hide a logical bug.
The share of distinct execution paths exercised, namely (paths executed / total possible paths) × 100.
The most rigorous structural metric and the least achievable, because paths grow combinatorially and 100% is impossible in any non-trivial codebase.
The share of functions called by at least one test, namely (functions called / total functions) × 100.
The coarsest structural metric, since high function coverage can still hide low statement or branch coverage inside the functions that were called.
Related Read: Statement Coverage vs Branch Coverage - Why 100% Can Still Ship a Bug
Specification metrics measure how much of what was specified, namely requirements, stories, or acceptance criteria, has actually been validated. It is the layer that carries traceability, compliance, and the QA-to-product conversation.
The share of documented requirements with at least one test mapped to them, namely (requirements with tests / total requirements) × 100.
The headline metric for compliance, and the mapping should run both ways, so every test names its requirement and every requirement lists its tests.
The share of user stories with tests mapped to their acceptance criteria, namely (fully covered stories / total stories) × 100.
The agile-native version of requirements coverage, more granular and closer to sprint delivery.
The share of individual acceptance criteria with tests, namely (criteria with tests / total criteria) × 100.
Finer again, and it surfaces the stories that look covered at the headline but are missing tests on specific criteria.
The share of product features with automated coverage, namely (features with automation / total features) × 100.
The coarsest specification metric, fine for high-level reporting and rarely enough on its own.
A confusingly named but common metric, namely the share of designed test cases that were executed, or (test cases executed / total designed) × 100.
It measures execution diligence, not design quality, so a high number with weak test design just manufactures false confidence.
Suggested Read: Top Test Coverage Techniques for Testers

Behavioural metrics measure how much of the business, namely its journeys, processes, and risk areas, is protected end to end. These track most closely with real risk and are the most useful for a release decision.
The share of critical user journeys with end-to-end automation, namely (journeys with end-to-end automation / total critical journeys) × 100.
A journey is a full user-facing flow to an outcome, such as order-to-cash or claim submission, and this is the single strongest indicator that outcomes are protected.
The share of risk-weighted areas with depth proportional to their risk, namely (risk-weighted areas adequately covered / total risk-weighted areas) × 100.
It needs a risk register and an honest view of where a defect would hurt most, so payments and regulated workflows get heavy coverage and low-risk areas get less.
Interesting Read: Risk-Based Testing Approach - Strategy & Techniques
The share of documented business processes with end-to-end coverage across every system involved, namely (processes with end-to-end automation / total processes) × 100.
Common in ERP and enterprise testing, where one process like procure-to-pay crosses many systems.
The share of defined scenarios within a feature or journey that have tests, namely (scenarios with tests / total defined scenarios) × 100.
More granular than journey coverage, and useful for surfacing the missed edge cases inside a journey.
The share of supported environments, namely browsers, devices, operating systems, and locales, that the tests run across, or (environment combinations tested / total supported combinations) × 100.
It matters most where the cross-browser or cross-device target is broad.
Every coverage metric records what the tests reached. None records whether the tests would actually catch a bug, which is the gap between touched and proved. Mutation testing closes it, and it is the most direct answer to the assertion-quality problem coverage numbers cannot see.
Mutation testing works by deliberately introducing small faults into the code, namely flipping a comparison, changing a boundary, or removing a statement, then running the suite against each mutated version. A healthy suite fails when the fault is introduced, which means it would have caught the bug. A suite full of weak or missing assertions passes, which proves the coverage was theatre.
The mutation score, namely the share of introduced faults the suite detects, is a far better read on suite quality than any structural percentage.
A programme that pairs a structural coverage number with a mutation score on its critical modules has evidence the coverage it reports would actually catch a regression.
Structural coverage is well tooled in every major language, and the output is broadly comparable, namely a percentage at the line, branch, statement, and function level with reports that highlight the uncovered code. The common tools by stack are worth knowing.
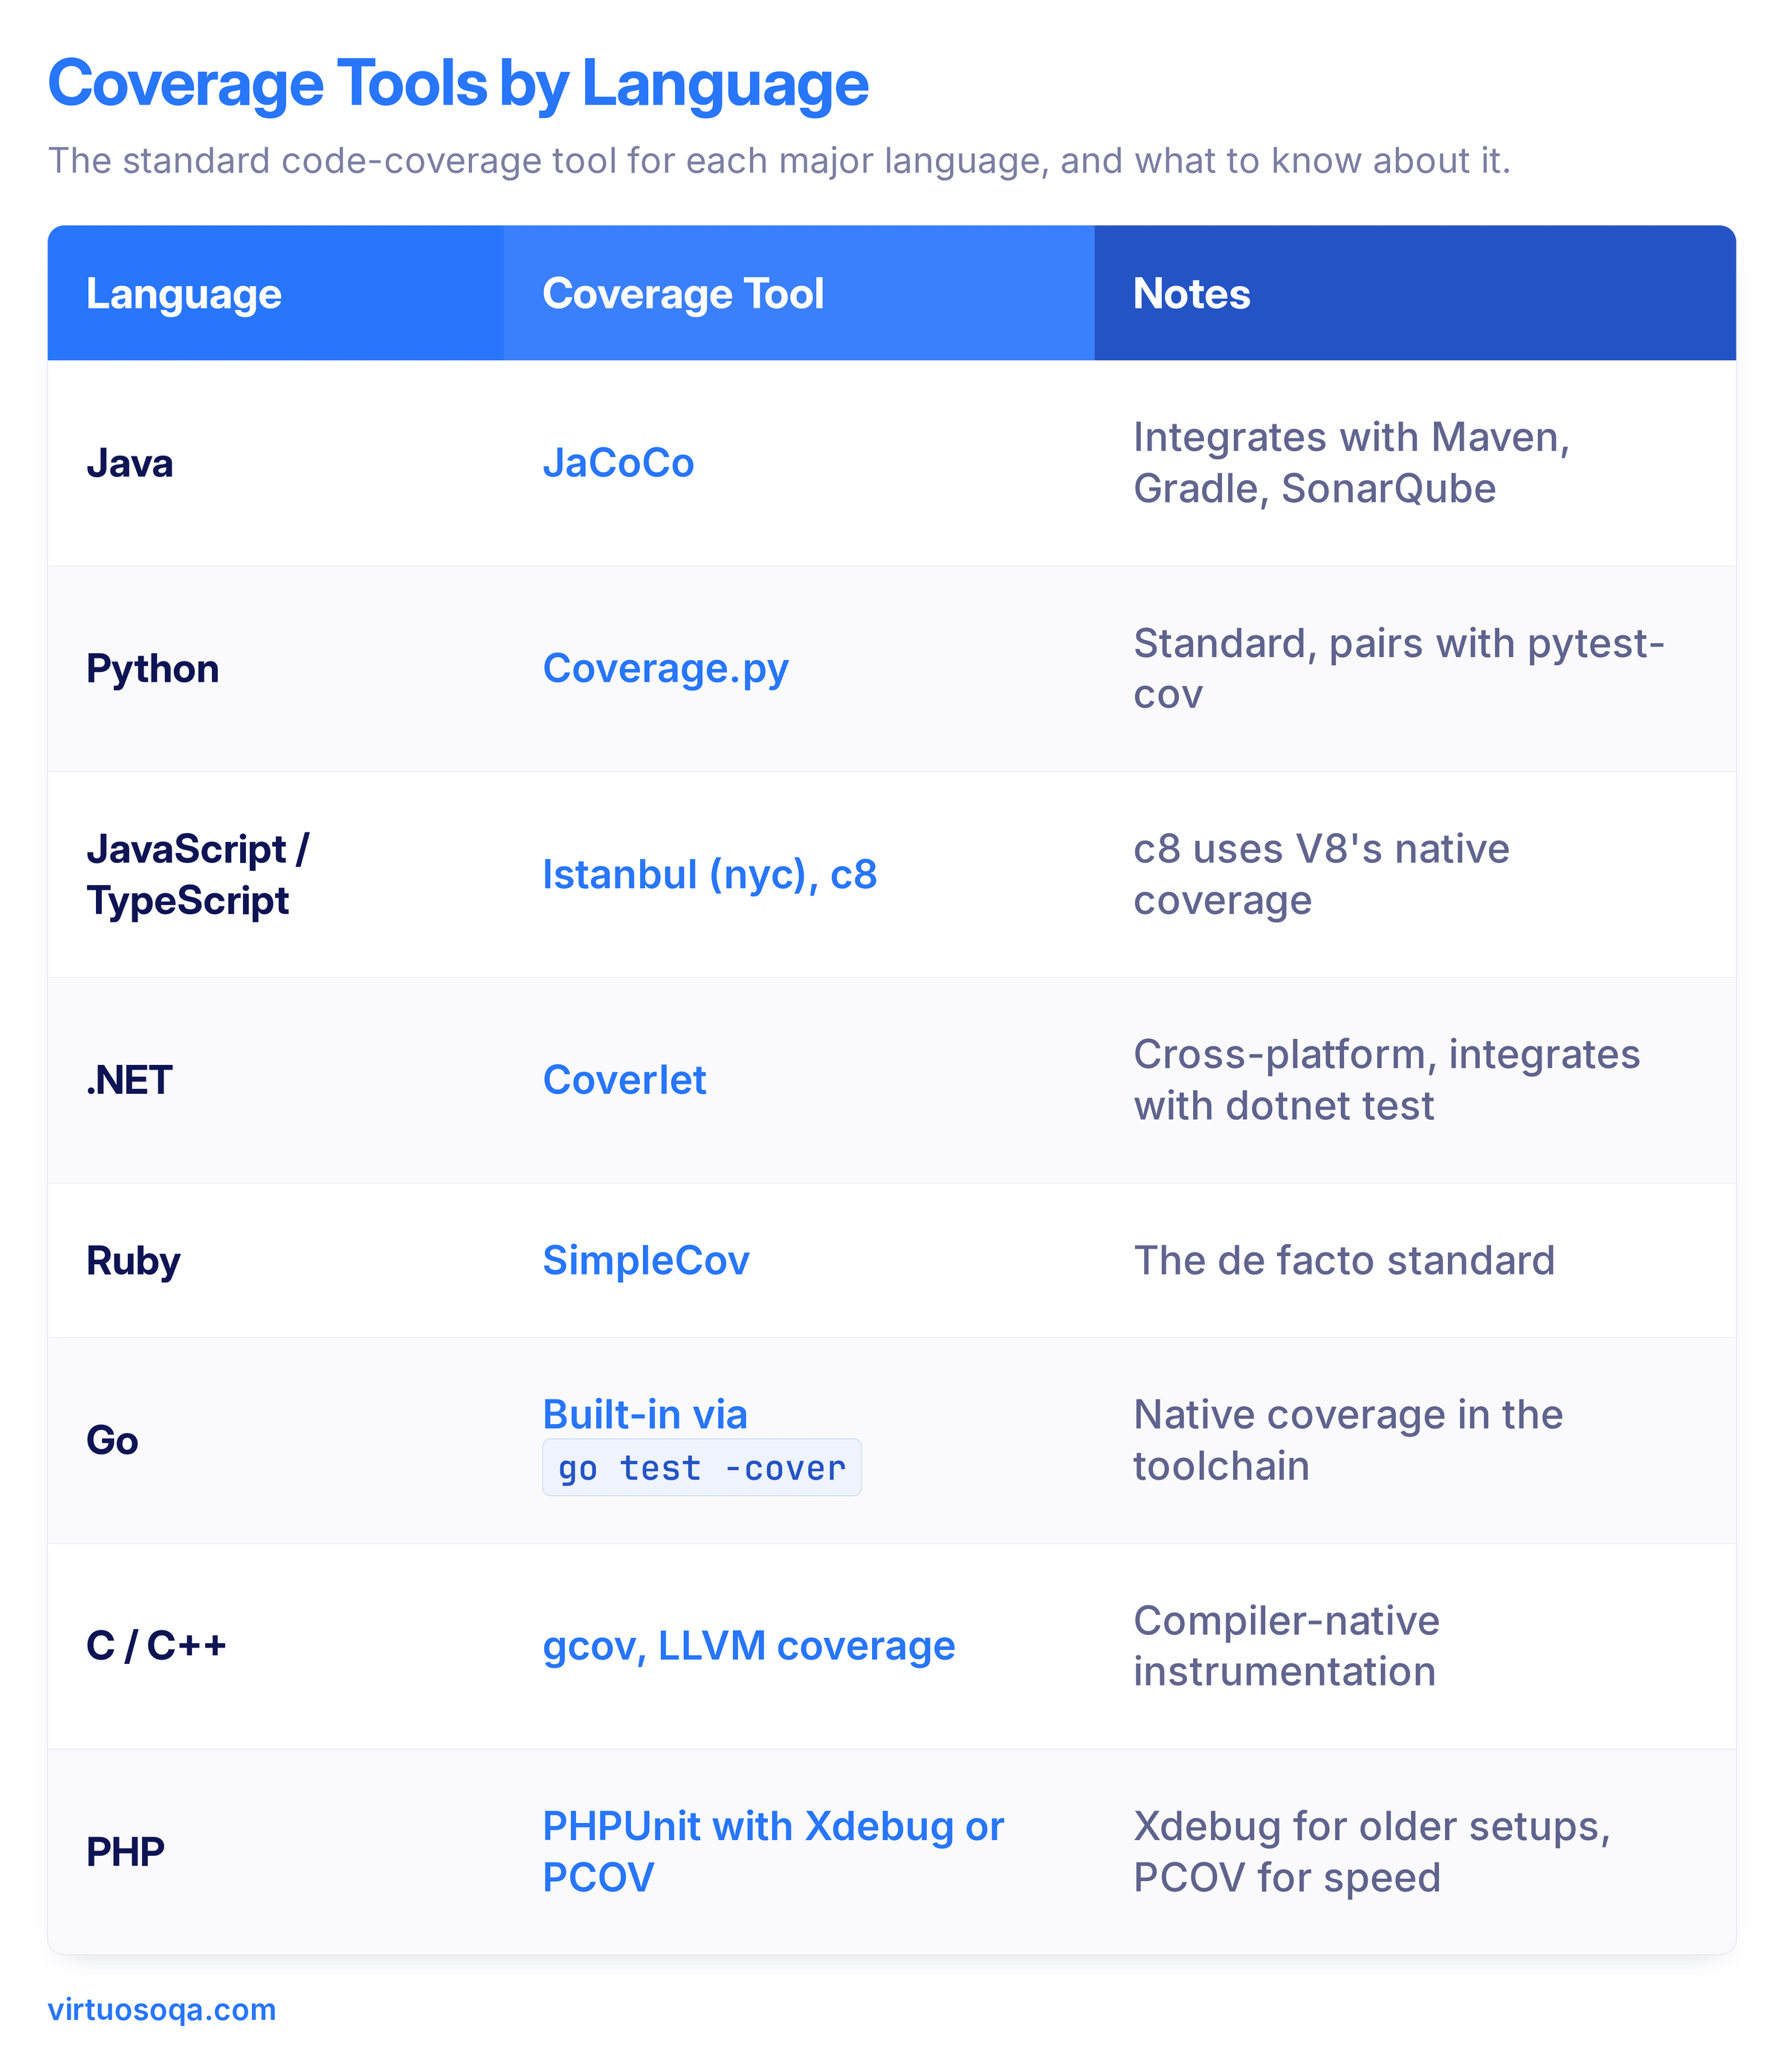
Structural coverage data should flow into a single dashboard with historical trends, broken down by module, risk weight, and ownership, which SonarQube, Codecov, Coveralls, and the major CI platforms support.
These tools share one limit, namely that they measure structure and stop there. They report which lines and branches ran, and they cannot tell you whether a customer journey completes, whether a requirement is verified, or whether the outcome the user depends on actually holds. That is the ceiling of the structural layer.
For the higher layers, namely functional, requirements, and journey coverage, the source of truth is a test management or behavioural platform rather than a code-coverage tool. Virtuoso QA sits at that layer, authoring journey-level tests in plain English and validating the UI, API, and database in a single test, so the coverage that maps most directly to release confidence, the coverage the tools above cannot see, is measured in one place. The requirement-to-test link stays machine-maintained through integrations with Jira, Xray, TestRail, and Azure Test Plans rather than kept by hand.
Different audiences need different metrics, and the usual mistake is reporting one number up the whole chain. What means something to a developer means little to an executive, and what an executive needs cannot be read off the developer's tools.
The mapping below is a sensible default.

A mature reporting structure shows the right metric to the right audience and refuses the false comparison between metrics that live at different layers. A branch-coverage number and a journey-coverage number are not better or worse than each other, they answer different questions.

A handful of anti-patterns show up again and again, and naming them is usually enough to stop a programme misleading itself.
Setting 100% line coverage as the goal produces suites that touch every line and prove nothing. Better targets stretch across several metrics and are weighted by risk, which raises the real question of how much test coverage is enough.
Coverage records what tests touched, quality is whether the app works, and the two are related but not the same. High coverage with weak assertions still misses defects.
Spreading coverage evenly across all features misallocates effort. Critical journeys deserve more depth than peripheral features, so coverage should follow risk, not fairness.
A programme reporting 90% line coverage and 30% journey coverage is in the worst spot of all, namely confident about the wrong thing.
Suggested Reads: What is Code Coverage Testing? Types and Practices
Strong journey coverage that cannot map specific tests to specific requirements fails audit, because the coverage is real but the documentation does not back it up.
Tests that are skipped, disabled, or quarantined for flakiness do not actually cover anything, and counting them inflates the number.
A codebase growing 20% a quarter through AI-assisted development cannot hold its coverage on a flat testing investment, so targets have to scale with code velocity.
AI-assisted development has changed several things about how coverage should be read, and the through-line is that the behavioural layer now matters more than the structural one.
The pattern across all of these is consistent. Behavioural and risk-based metrics gain weight, structural metrics stay valid but lose their central place, and the platform doing the testing matters as much as the tests themselves.

A coverage programme is more than a number on a dashboard, and the practices below are what separate a programme that produces real signal from one that produces noise.
Decide which metrics live at each layer and which audience sees each, and stop reporting the wrong metric to the wrong room.
Keep a risk register naming the journeys and areas where a defect would hurt most, set heavier targets there, and make the asymmetry deliberate.
A steady 70% tells one story and a 70% that fell from 85% over three quarters tells a very different one.
Tests designed but not running do not count, and quarantined or skipped tests should be reported on their own line.
Every test names its requirement and every requirement lists its tests, generated automatically rather than reconstructed the week before an audit.
Code, requirements, journey, and defect-escape numbers together give a fuller picture than any one of them, and the combination resists the gaming that any single metric invites.
Most production incidents live between modules, not inside them, where two units each work in isolation but disagree about the data passing between them. Past the 70% to 80% mark on unit coverage, an hour spent on integration testing at the seams buys more release confidence than another hour of unit tests, so track the integration layer's coverage on its own line.
The question is not "did we hit 80%," it is "do we cover the right things, at the right depth, with the right evidence." Coverage feeds that decision, it does not make it.
Most programmes can produce a structural number easily and struggle to produce an honest behavioural one, because journey and business-process coverage are exactly the kind that break under maintenance and sprawl across disconnected suites. That is the gap that widens as AI writes more of the code, and it is where the platform is aimed.
Virtuoso is an AI-native platform built to make behavioural and risk-based coverage achievable at enterprise scale while still supporting the structural and specification metrics a mature programme needs. A few specifics matter for coverage in particular.


Try Virtuoso QA in Action
See how Virtuoso QA transforms plain English into fully executable tests within seconds.
