Blog
What is Code Coverage Testing? Types and Practices

Rishabh Kumar
Published on






Table of contents
Lorem ipsum
Lorem ipsum
Lorem ipsum
Lorem ipsum
Lorem ipsum
92% coverage. Green build. Shipped Thursday. Broke Friday, in a branch nobody had asked about, and the review that followed opened with four words every QA leader has heard at least once. We had coverage.
Two things are true at the same time here, and holding both is the whole skill. Coverage is one of the few quality metrics with fifty years of tooling behind it, cheap to collect, precise about what it reports, and capable of exposing blind spots nothing else surfaces as fast. Coverage is also the metric most often quoted in the sentence immediately preceding an outage.
The resolution is unglamorous. Coverage answers a narrow question extremely well, and teams get burned when they ask it a broader one. Everything below is about knowing which question you are asking.
What is Code Coverage Testing?
Code coverage testing measures how much of a codebase is exercised by an automated test suite. The figure comes from an instrumented run, where the coverage tool watches which lines, branches, conditions, or paths execute and reports the proportion reached against the total.
The original purpose was narrow and useful. If a developer changed a function and the unit tests passed, coverage data revealed whether the tests had actually executed the modified code or merely run around it. A line that never executes in any test is a line nobody has verified, regardless of how green the suite looks.
The metric has since expanded. Modern tools report multiple subtypes, integrate into pull request workflows, gate builds against thresholds, and feed dashboards that engineering leadership reviews weekly. The discipline is now a fixture of every serious development organisation.
What has not changed is the underlying meaning. Coverage measures execution. It does not measure whether the test asserted the right behaviour, whether the right edge cases were exercised, whether the workflow a customer actually takes still completes, or whether the application meets its requirements. Treating execution as a proxy for quality is the central error, and the rest of this page is largely about avoiding it.
Types of Code Coverage
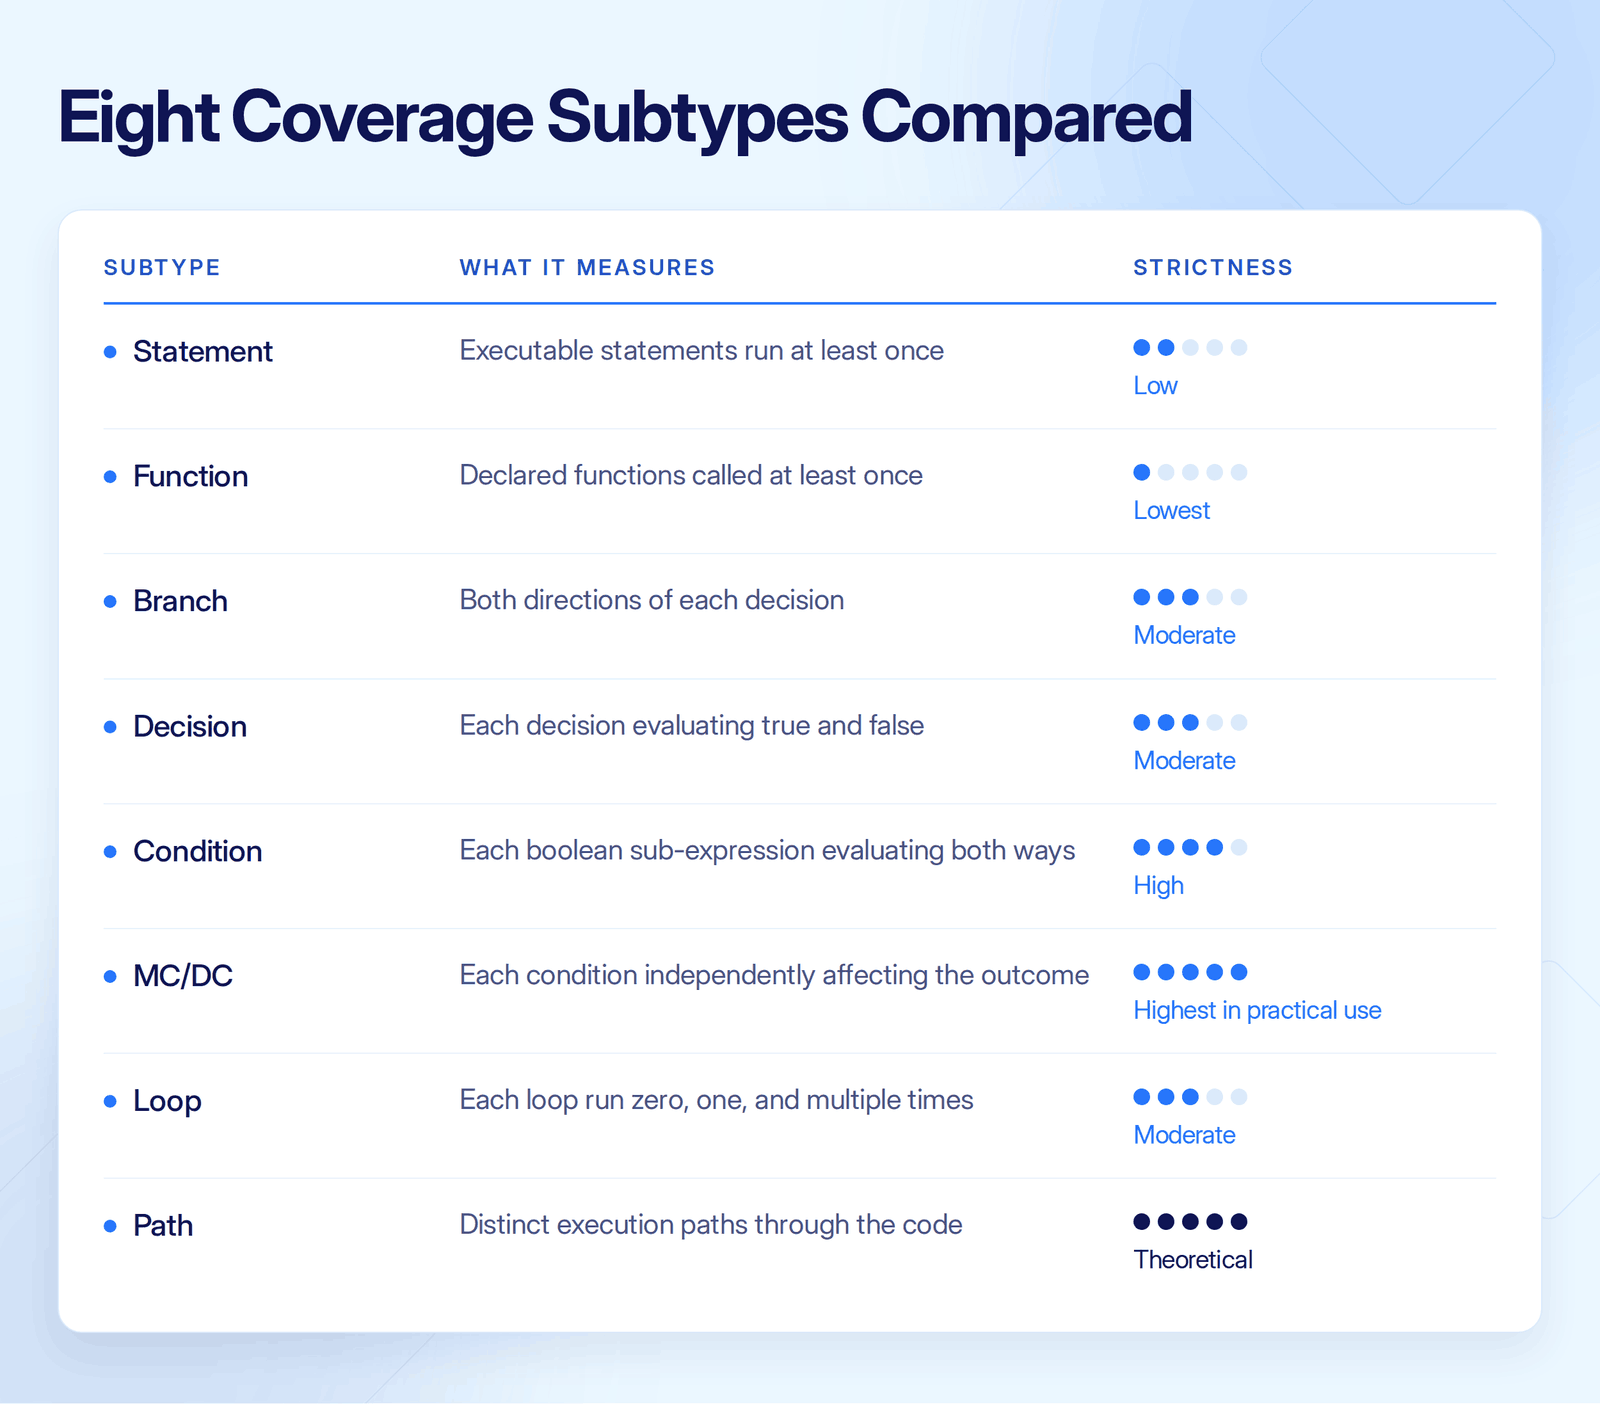
1. Statement Coverage
Statement coverage measures the proportion of executable statements run by at least one test. A statement is typically a single line of executable code, though the exact definition varies by language and tool.
The simplest subtype to report and the easiest to game. A test that imports a module and calls one function can register coverage on every initialised constant in that module without validating any behaviour at all.
2. Branch Coverage
Branch coverage measures the proportion of decision branches exercised. For every conditional, every switch case, every short-circuit boolean, it tracks whether both the true and false paths have run.
A more honest signal than statement coverage. Tests covering only the happy path of every conditional will show high statement coverage and low branch coverage on the same code, and the gap between the two is one of the most useful diagnostic numbers in any coverage report. The full comparison lives in our breakdown of statement coverage vs branch coverage.
3. Decision Coverage
Decision coverage tracks whether each decision point has evaluated to both true and false at least once across the test runs. Subtle distinctions exist between branch and decision coverage in formal definitions, and in the DO-178C context the two are treated as synonyms. For most enterprise teams they can be read as equivalent.
4. Condition Coverage
Condition coverage measures whether each boolean sub-expression within a compound condition has evaluated both ways. A condition such as a && b needs four separate evaluations for full condition coverage, not the two that satisfy branch coverage.
More demanding than branch coverage, and worth the cost in contract-heavy or safety-adjacent code where compound boolean logic carries real business consequences.
5. Modified Condition/Decision Coverage
MC/DC requires that each condition in a decision has been shown to independently affect the outcome. It is mandated rather than recommended in several safety standards, namely DO-178C where Table A-7 requires it for Software Level A, ISO 26262 at ASIL D, and IEC 61508 where it is highly recommended at SIL 4.
The practical appeal is that MC/DC needs on the order of N+1 tests for a decision with N conditions, rather than the 2^N that exhaustive multiple condition coverage demands. Rarely applied outside regulated domains, but worth knowing as the most rigorous variant in real use.
6. Path coverage
Path coverage measures the proportion of distinct execution paths exercised. A function with multiple branches has an exponential number of paths, so full path coverage is impractical for any non-trivial program.
Path coverage is a theoretical ceiling rather than a working target, and mature programmes apply it selectively to high-risk code rather than portfolio-wide.
7. Function coverage
Function coverage measures the proportion of declared functions called by at least one test. The lightest subtype, and the easiest to score well on.
Useful as an early diagnostic on a young codebase, largely uninformative once most functions are called by something somewhere.
8. Loop coverage
Loop coverage measures whether each loop has run zero times, exactly once, and more than once. The subtype catches off-by-one errors and boundary conditions that branch coverage misses.
It is underused relative to its value, since loop bugs are common and loop coverage is one of the cheapest ways to surface them.
How is Code Coverage Measured?
The mechanics are unglamorous. A coverage tool instruments the codebase, usually by injecting probes into the compiled or interpreted form, then runs the suite while collecting execution data on every probe.
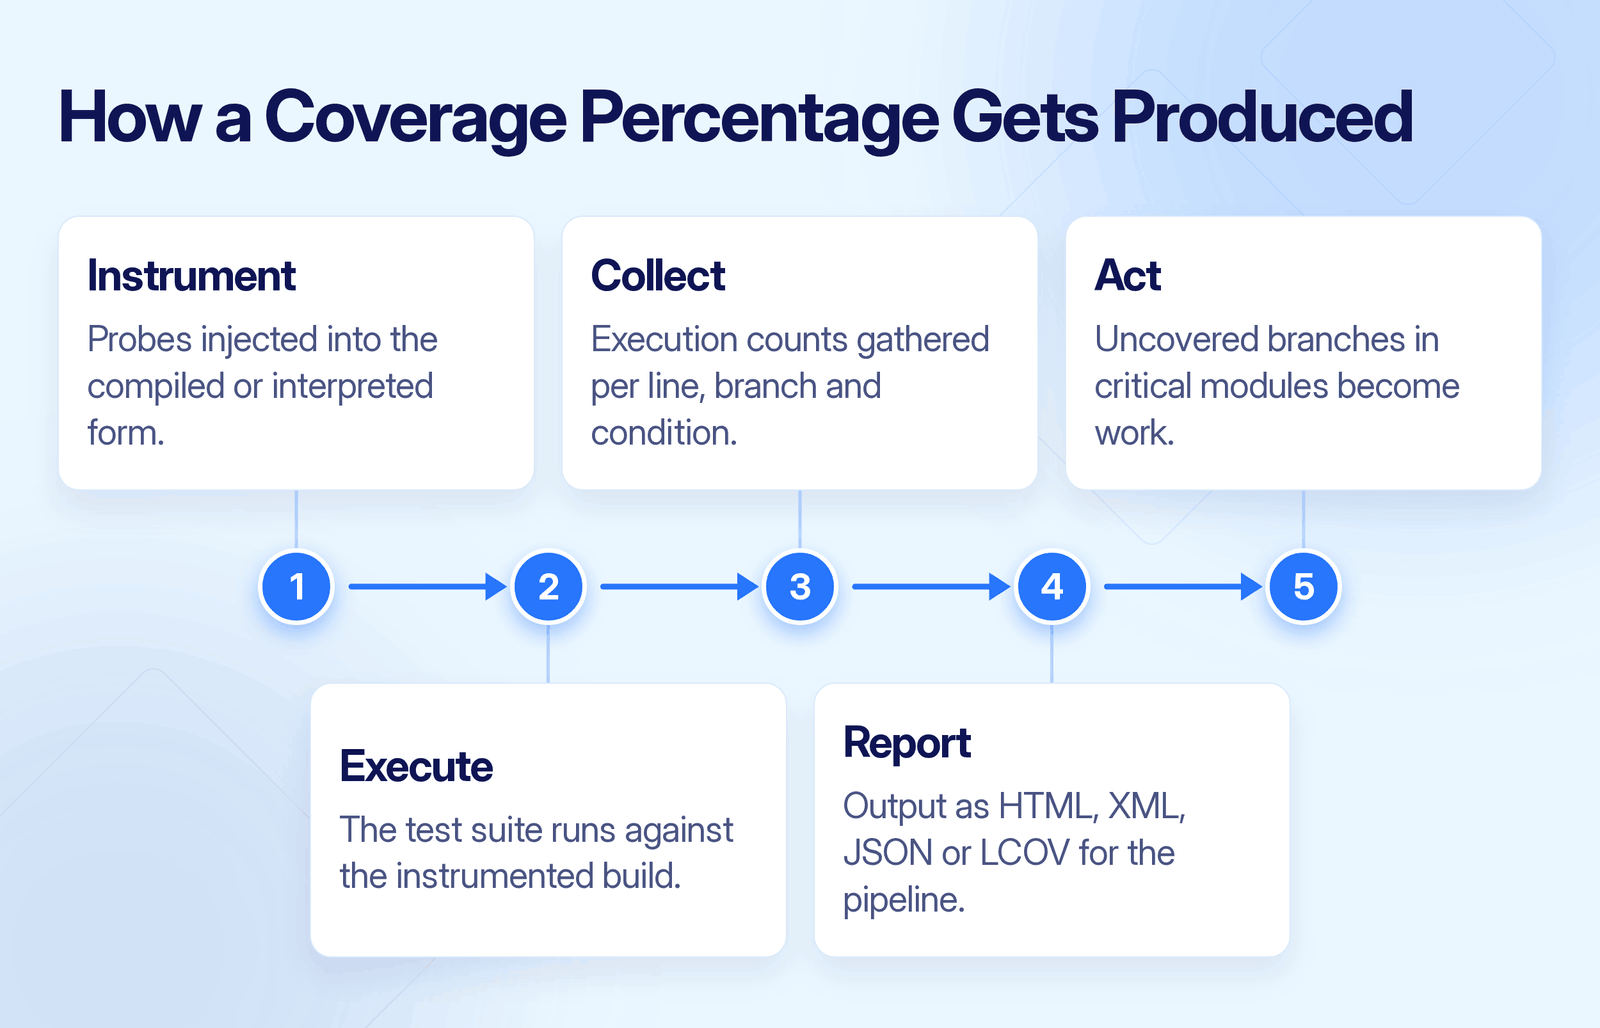
Each stage is worth understanding, because most coverage arguments turn out to be arguments about one of them.
Instrumentation Comes First
The tool injects probes into the compiled or interpreted form of the code, in effect tiny counters attached to every statement, branch and condition. The application's behaviour does not change, but every execution now leaves a trace.
The Suite Runs Against the Instrumented Build
The tests execute exactly as they normally would, and every probe they touch increments its counter. Whatever never runs stays at zero, and that zero is the entire signal the metric exists to produce.
Collection Aggregates the Counts
Raw execution data is gathered per line, per branch and per condition, then rolled up to file, module and project level. The same run can therefore produce very different percentages depending on where the reporting line is drawn, which is why module-level figures beat a single project-wide number.
Reporting Turns Counts into Consumable Formats
HTML serves the humans, while XML, JSON and LCOV feed the CI platform, the quality gate and the pull request check, so most toolchains ingest coverage without custom work.
Acting on the Output is the Step No Tool Performs
The report shows exactly which lines and branches never ran, and the value of the entire pipeline depends on someone turning the uncovered branches in critical modules into work. A report nobody reads measures nothing.
Three numbers belong together. Statement coverage shows what was reached, branch coverage shows what was decided, and condition coverage shows what was actually evaluated. A report showing only statement coverage is hiding the more useful figures behind the easiest one.
The 100% Coverage Trap
The most expensive mistake in code coverage is treating 100% as the goal. Teams chasing the number rather than the signal write tests that exercise code without validating behaviour, pad suites with trivial assertions, and produce figures nobody can act on.
Worth grounding the argument in something external, because coverage targets are usually set by whoever argues hardest. Google's published guidance treats 60% as acceptable, 75% as commendable and 90% as exemplary, while explicitly discouraging top-down mandates and noting that gains beyond a point are logarithmic.
Getting from 30% to 70% is worth real effort, and arguing about 90% to 95% usually is not.
Three failure patterns recur.
Coverage without assertion: A test that calls a function and checks nothing produces coverage and proves nothing. Assertion density, meaning meaningful assertions per executed line, matters as much as the coverage figure itself.
Coverage of the wrong code: A team rewarded for the headline number tests the easy parts first. Stable utility classes reach 100%, while volatile business logic and error-handling paths, where defects actually live, sit at 40%. The aggregate looks healthier and the risk profile gets worse.
Coverage of dead code: Code that runs in tests but never in production still counts toward the percentage. The metric tracks execution in the suite, not relevance to the user, and deleting dead code is a better quality move than testing it.
Thresholds work as a floor rather than a ceiling. A pull request dropping coverage by ten points warrants attention. A pull request holding coverage at 70% while improving assertion density and adding end-to-end tests is a stronger contribution than one adding a thousand trivial unit tests to reach 95%.
Practical Tips for Sustainable Coverage
The practices below compound rather than producing a one-time spike followed by decay.
1. Report Subtypes Side by Side
Always show statement, branch and condition coverage together, since a team reporting one number is hiding the more useful comparisons. The gap between statement and branch is the diagnostic that surfaces shallow tests.
2. Treat Coverage as a Leading Indicator
Trends beat absolutes. A flat line at 75% is healthier than oscillation between 80% and 90%, because stability indicates that tests are keeping pace with code change.
3. Set Thresholds Per Module, Not Just Per Project
A project-wide threshold lets stable modules subsidise volatile ones, and module-level thresholds force the conversation about which areas need attention.
4. Work Through Uncovered Branches in Critical Paths
Reports list uncovered lines and branches by file. The fastest improvement to quality, as opposed to the metric, comes from the uncovered branches in business-critical modules rather than trivial uncovered lines elsewhere.
5. Pair Coverage With Mutation Testing
Mutation testing makes small changes, namely a flipped comparison operator or an adjusted constant, and checks whether the suite notices. A suite that passes despite mutations executes code without verifying behaviour, which is the assertion-density problem coverage cannot see.
6. Exclude Generated, Vendor and Test Code by Configuration
Figures that include code the team did not write are misleading. Every major tool supports excluding directories, files or annotated regions, and configuring it properly at project start saves years of metric noise.
7. Use Coverage to Find Dead Code
Areas never executed in tests and never executed in observed production traffic are candidates for deletion. Coverage data combined with production telemetry is a clean signal for safe removal.
8. Surface Coverage Delta in Pull Request Review
The delta tells a reviewer what to do next, where the absolute figure only tells them where things stand. Minus 2% in a critical module is a different conversation from the same delta in a utility module, and inline visibility removes the friction that otherwise stops teams acting on it.
9. Never Use Coverage as an Individual Performance Metric
Tying it to performance reviews produces game-the-metric behaviour faster than almost any other software engineering measure. The metric belongs to the team and the codebase.
A Coverage Policy Worth Adopting
The checklist below is what a defensible coverage policy looks like once the arguments have been had.
Thresholds set per module, with a documented rationale for any module below the project floor.
Statement, branch and condition coverage reported together.
Coverage delta visible in every pull request review.
Assertion density tracked alongside coverage.
Mutation testing supplementing coverage on high-risk modules.
Generated, vendor and test code excluded by configuration.
Coverage treated as a leading indicator, not a target.
Coverage results feeding the same dashboards as other quality metrics, not a separate silo.
Coverage gaps in business-critical modules driving sprint priorities.
Coverage never used as an individual developer performance metric.
A stated policy on which subtype gates merges, at what threshold, and who can override it.
What Changes When an Assistant Writes the Code
The 2025 DORA report found around 90% of technology professionals now use AI at work. Over 80% say it makes them faster, and about 30% say they do not fully trust the code it writes. Faster code plus low trust means more checking, and checking is what coverage tools are for.
AI also changes the coverage numbers themselves. AI-written code tends to include more safety checks than a human would write, so the same feature ends up with more branches to cover. Regenerate a module and the percentage can drop even though nothing got riskier.
Two simple habits deal with this. When the number drops after AI rewrites something, check whether the code got riskier or just got bigger before reacting. And run coverage on every merge instead of overnight, because a report that arrives twelve hours late helps nobody.
Coverage still matters as much as it did. It just cannot be the only thing a release decision rests on.
Where Code Coverage Stops and End-to-End Coverage Begins
Code coverage is the developer's signal. Whether the customer's workflow still completes is a different signal, produced at a different layer, and the two are complementary, not interchangeable.
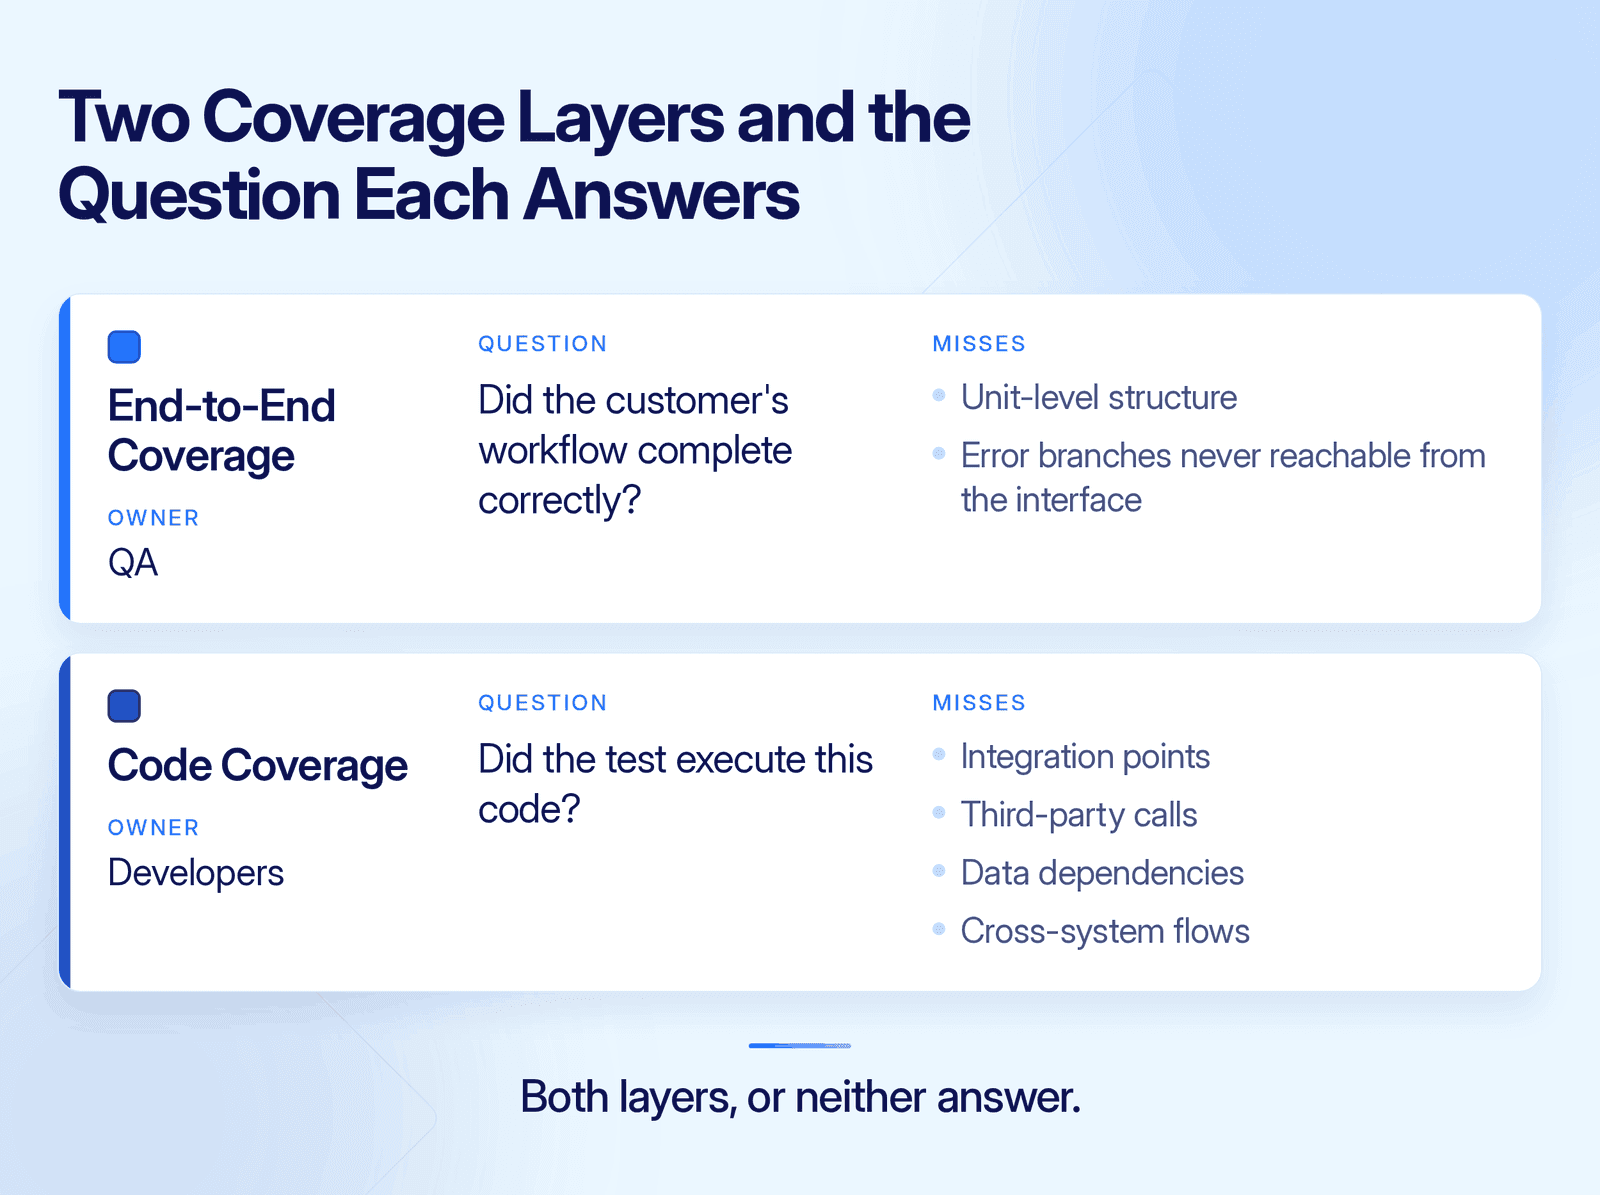
Code coverage answers whether the test executed the code: It is cheap, fast and precise, and it is blind to everything above the unit boundary.
End-to-end coverage answers whether the workflow completed correctly: A team can hold 95% code coverage and still ship a broken claim submission, patient admission or checkout, because the failure lives at the integration points, the third-party calls, the data dependencies and the cross-system flows that line-level coverage never touches.
The reverse holds too: A team with lower code coverage can ship reliably, provided the workflows customers actually take are validated end to end against current behaviour.
Mature programmes run both. Code coverage at the developer-test layer for fast feedback on unit-level structure, and end-to-end validation for confidence that the customer outcome still holds.
How Virtuoso QA Approaches Coverage Above the Code Layer
Virtuoso QA operates above the code-coverage boundary and does not replace unit-level coverage tools. What it covers is the layer they cannot, namely whether business-critical workflows still work after humans and assistants together have rewritten the code beneath them.
Plain-English authoring, so product, QA and development review end-to-end coverage in the same conversation
GENerator builds tests from existing assets and specifications, keeping coverage growing at the pace features ship
One journey drives the UI, calls the API and queries the database, covering the integration points line-level coverage cannot see
Proposed self-healing repairs at approximately 95% user acceptance, so a refactor becomes a review queue instead of a rebuild
AI Root Cause Analysis attaches screenshots, logs and the affected functional area to every failure, cutting triage from an hour to minutes
Composable checkpoint libraries, so coverage compounds across products instead of restarting after every refactor
Governed autonomy throughout, AI proposes, a deterministic engine executes, a human approves, everything is recorded
Traceability through Jenkins, Azure DevOps, GitHub Actions, GitLab, Jira, Xray and TestRail, with exportable reports for the audit trail
Keep the coverage tooling and the module-level thresholds. The change worth making is to stop letting a line-level percentage carry a release decision alone, because instrumentation shows which code the tests touched, and whether the customer got what they came for is a different question.
Related Reads
Frequently Asked Questions
What are the main types of code coverage?
Is 100% code coverage achievable or desirable?
What is the difference between code coverage and test coverage?
How does code coverage fit into CI/CD pipelines?
Does high code coverage guarantee software quality?
" height="10.182000000000016px" id="C361dJxCp" width="11.692999999999984px"/></svg>)