
Blog
Test Coverage vs Customer Journey Confidence - Expert Insights

Published on
March 18, 2026


High coverage scores still let broken journeys reach customers. Discover why customer journey confidence is the quality metric your business actually needs.
Every Monday morning, QA leaders across the world open their dashboards to the same number: test coverage percentage. 78%. 85%. 92%. The number goes up. Leadership nods. Everyone moves on.
Then on Tuesday, a customer tries to complete a checkout and the payment form hangs. On Wednesday, a user in Germany cannot log in because a localisation update broke the authentication flow. On Thursday, the CEO gets a Slack message from the head of sales: "Three enterprise prospects hit errors during their trial. We might lose the deal."
The coverage number never moved. It still says 92%.
This is the fundamental problem with test coverage as a quality metric. It tells you how much of your code was executed during testing. It tells you nothing about whether your customers can actually complete the workflows that generate revenue.
The software industry has spent two decades optimising for the wrong number. It is time to replace it.
The concept is seductive in its simplicity. Run your tests. Measure the percentage of code they touch. Higher percentage equals higher quality. Ship with confidence.
Except it does not work that way.
A team can achieve 95% code coverage and still ship a broken checkout flow because that coverage was distributed across low risk utility functions, internal admin screens, and deprecated features that nobody uses. Meanwhile, the five step payment journey that generates 80% of revenue had exactly two test cases covering it, both written eighteen months ago, neither accounting for the new payment provider integration that went live last sprint.
Industry research confirms this disconnect. Coverage metrics measure whether code was executed during testing, but they reveal nothing about whether the logic inside that code was actually validated. A line can be "covered" without the important behaviour ever being tested. High statement coverage without depth creates what practitioners increasingly call a false sense of security, where the riskiest defects remain undiscovered in branching logic, error handling, and rarely exercised conditions.
This is not a theoretical problem. Poor software quality costs the global economy trillions annually, with the Consortium for Information and Software Quality documenting the US economy alone losing over $2.41 trillion to software failures. And these failures do not happen because teams had low coverage numbers. They happen because teams optimised for coverage percentage instead of customer outcomes.
The first failure is distribution blindness
Coverage percentage is an aggregate. It treats a test covering an internal logging function the same as a test covering the payment processing flow. Both contribute equally to the number on the dashboard. But they do not contribute equally to revenue protection.
The second failure is temporal decay
A test that passed last quarter still counts toward your coverage number today, even if the feature it covers has been refactored three times since. Coverage is a snapshot that pretends to be a continuous signal. In environments where enterprise applications release updates weekly or even daily, yesterday's coverage number is already stale.
The third failure is confidence conflation
Leadership sees 90% coverage and assumes 90% confidence. These are completely different concepts. Confidence requires knowing that a specific workflow works, right now, across every browser and device your customers actually use. Coverage only tells you that 90% of your code was touched by some test at some point.
Customer journey confidence is a fundamentally different way to think about quality. Instead of asking "what percentage of our code is tested," it asks a question that every CEO, CTO, and head of product actually cares about: "For every revenue critical workflow, what is our confidence that it works, right now, across every environment our customers use?"
This reframes quality measurement around business outcomes rather than engineering inputs.
A customer journey is the complete sequence of steps a real user takes to accomplish a goal that matters to the business. In ecommerce, that might be: search for a product, view the product detail page, add to cart, proceed to checkout, enter payment information, confirm the order, receive confirmation. In a SaaS application, it might be: log in, navigate to the dashboard, create a new record, complete a workflow, export a report. In an enterprise system like SAP or Salesforce, it might be: create a purchase order, route it through the approval chain, generate the invoice, and reconcile the payment.
Each of these journeys either works or it does not. And when it does not work, revenue is at risk.
The numbers are staggering. Research from the Baymard Institute calculates the average online cart abandonment rate at approximately 70%, with ecommerce businesses collectively losing an estimated $18 billion annually to abandoned transactions. While many of these abandonments stem from pricing or shipping concerns, a significant portion traces directly to checkout friction, website errors, and broken user flows. A single bug in the checkout process can push abandonment rates above 75%.
Journey confidence asks you to assign a measurable score to each of these critical paths. Not an aggregate percentage across your entire codebase. A specific, current, environment aware confidence level for each workflow that makes your business money.
A journey confidence score is not a single test result. It is a composite signal built from multiple dimensions.
Functional validation is the first dimension
Does the journey complete successfully from the first step to the last? Does every interaction, form submission, API call, and page transition behave as expected? This is what most teams think of as "testing," but it is only one piece.
Cross environment validation is the second dimension
That journey might work perfectly on Chrome on a MacBook. Does it work on Safari on an iPhone? On Edge on a Surface tablet? On Firefox on Ubuntu? Enterprise customers use over two thousand distinct browser, operating system, and device combinations. A journey that works on three of them is not a journey you can be confident about.
Temporal validation is the third dimension
That journey worked this morning. Does it still work after the 2pm deployment? After the database migration that ran last night? After the third party payment provider pushed their own update? Journey confidence is not a point in time measurement. It is a continuous signal.
Data validation is the fourth dimension
The journey works with the test data your team always uses. Does it work with a German address format? With a Japanese character set in the name field? With an expired credit card that should trigger a specific error message? Real customers bring real data, and real data breaks journeys that synthetic data never reveals.
When you combine these four dimensions, you get something that coverage percentage has never provided: an honest answer to the question "can our customers do the thing that makes us money?"

If journey confidence is so obviously better, why does every QA dashboard still default to coverage percentage?
The answer is measurement difficulty. Coverage percentage is trivially easy to calculate. Your testing framework generates it automatically. It produces a clean number that fits in a slide deck. It trends upward over time, which makes everyone feel good. It requires no judgement, no business context, and no cross functional collaboration to produce.
Journey confidence is harder. It requires someone to define which journeys matter most. It requires tests that span the entire user experience, not just individual functions. It requires execution across multiple environments. It requires continuous monitoring, not just pre release validation. It requires connecting QA outcomes to business outcomes in a way that makes leadership pay attention.
For most of the history of software testing, this was impractical. Writing and maintaining end to end journey tests across multiple browsers was so expensive and brittle that teams rationally chose the easier metric. Selenium scripts that broke every time a CSS class changed. Manual regression cycles that took weeks and still missed critical paths. Test environments that never matched production. The tooling made journey confidence measurement impossible at scale.
That era is ending.
The shift from coverage thinking to journey thinking requires a platform built for end to end workflow validation, not unit level code execution tracking. This is where AI native test automation changes the equation.
Traditional test automation frameworks force teams to think in terms of individual test cases tied to individual functions. This architecture naturally produces coverage oriented metrics because the tests themselves are designed around code structure, not customer behaviour.
AI native platforms like Virtuoso QA approach testing from the journey level. Using Natural Language Programming, teams author tests that mirror actual customer workflows. Instead of writing code that targets specific DOM elements, a tester writes in plain English: "Navigate to the login page. Enter the username. Enter the password. Click sign in. Verify the dashboard loads." This is not just a usability improvement. It is an architectural shift. When tests are authored as journeys, the metric that emerges naturally is journey completion, not code coverage.
StepIQ accelerates this further by autonomously analysing the application under test and generating test steps based on UI elements, application context, and expected user behaviour. Rather than manually mapping every step in a checkout flow, the platform identifies the journey structure and suggests the validation logic. This means teams can build journey level coverage for critical workflows in hours rather than weeks.
Journey confidence is only meaningful if it stays current. A confidence score from last week is not confidence. It is history.
This is where self healing becomes essential. In enterprise applications, UI changes are constant. A Salesforce release updates Lightning components three times per year. An SAP S/4HANA migration changes form structures. A marketing team updates the checkout page layout for a seasonal campaign. In traditional frameworks, any of these changes breaks existing tests, which means your journey confidence score drops to zero until someone manually fixes every broken locator.
Virtuoso QA's AI powered self healing maintains approximately 95% accuracy in automatically adapting tests when the application changes. Element selectors shift. Form structures evolve. Button labels change. The platform detects the change, identifies the intended interaction, and updates the test automatically. Journey confidence stays current without manual intervention.
Below video lets you explore Virtuoso QA's self-healing, using ML algorithms to self-heal tests where applications have dynamic changes (IDs, Xpaths, Class names, even labels on screen) to reduce the amount of time spent maintaining tests.
For enterprise teams, this is the difference between a confidence score that reflects reality and a coverage number that reflects the last time someone had time to fix the broken tests.
A journey that works in one browser is not a confident journey. All Customers don't use Chrome on a MacBook. Enterprise users access applications on managed Windows devices running Edge. Mobile workers use Safari on iPhones. International teams use Firefox across a range of operating systems.
Virtuoso QA's cloud execution grid supports over 2,000 browser, operating system, and device configurations. This means a single journey test authored once can be validated across the complete range of environments your customers actually use. Not three browsers. Not five devices. The full matrix.
This transforms journey confidence from a theoretical concept into a measurable, continuous, environment aware signal. For every critical workflow, you can answer the question: "Does this work everywhere our customers need it to work, right now?"
When a journey fails, the question is not "which line of code broke?" The question is "why can't our customer complete this workflow?" These are different questions, and they require different diagnostic capabilities.
AI Root Cause Analysis operates at the journey level. When a checkout journey fails at step four of seven, the platform captures screenshots, DOM snapshots, network logs, API responses, and performance metrics at the point of failure. It then analyses this evidence to identify not just what broke, but why it broke and what should be done about it. Was it a backend API returning a 500 error? A frontend element that failed to render after a deployment? A third party script that timed out?
This is the diagnostic capability that turns a red indicator on a journey confidence dashboard into an actionable remediation path. Coverage dashboards tell you a number changed. Journey confidence dashboards tell you which customer workflow is broken, why, and what to fix first.

If you are a QA leader reading this, you are probably asking: how do I actually implement this? The transition from coverage metrics to journey confidence does not require throwing away everything you have. It requires adding a layer of business aware measurement on top of your existing testing infrastructure.
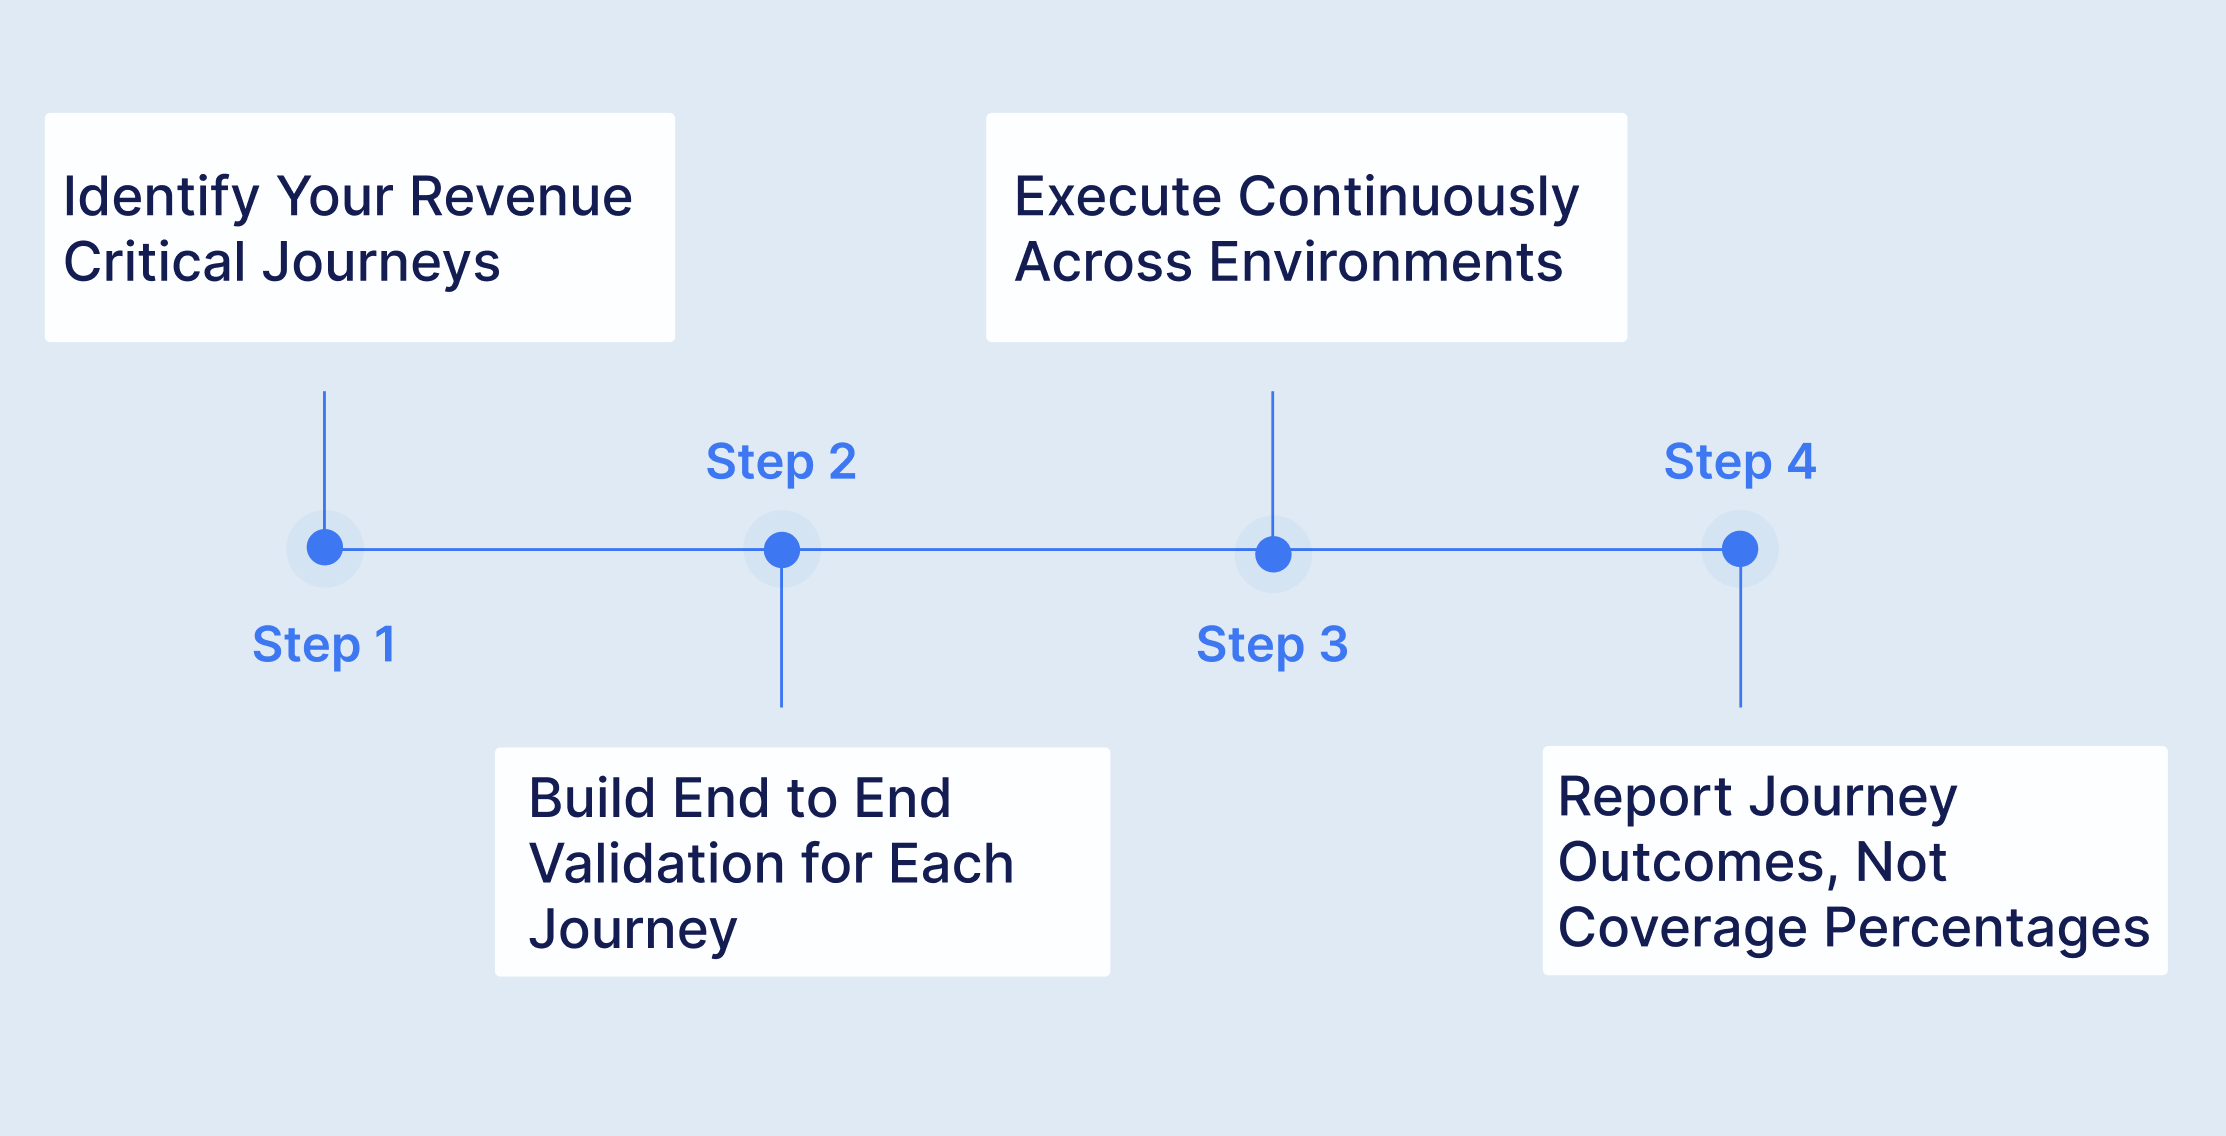
Start with the workflows that directly generate or protect revenue. For most organisations, this is a surprisingly short list. The login flow. The search and discovery flow. The purchase or transaction flow. The onboarding flow. The renewal or subscription management flow. Five to ten journeys typically represent 80% or more of the business value in a digital product.
Do not try to map every possible user path. Start with the ones where failure equals lost revenue. These are the journeys your CEO should see on their morning dashboard.
For each revenue critical journey, build a complete end to end test that validates the full workflow from first interaction to final confirmation. This means spanning the UI layer, the API layer, and in many cases the database layer to verify that the entire stack behaves correctly for the full customer experience.
Virtuoso QA's unified functional testing approach enables exactly this. A single journey test can combine UI interactions, API validations, and database queries within the same workflow. This is not three separate tests correlated after the fact. It is one continuous validation of the complete customer experience.
Composable testing accelerates this for enterprise applications. Pre built, reusable test components for common business processes, such as Order to Cash, Procure to Pay, or Hire to Retire, can be configured for specific application instances in approximately 60 hours rather than the 1,000+ hours typically required to build from scratch. Verified enterprise outcomes demonstrate 94% effort reduction using this approach. For organisations running SAP, Salesforce, Oracle, Dynamics 365, or other enterprise cloud systems, composable libraries provide immediate journey level coverage for standard workflows.
Schedule your journey tests to run on every deployment, every environment change, and at regular intervals throughout the day. Not weekly. Not as part of a pre release regression cycle. Continuously.
Integrate with your CI/CD pipeline. Jenkins, Azure DevOps, GitHub Actions, GitLab, CircleCI, or Bamboo. Every code change triggers a journey confidence check. Every confidence check runs across the full range of browsers and devices your customers use. The result is a real time signal, not a periodic report.
Enterprise organisations using this approach execute over 100,000 test runs annually through their CI/CD pipelines, validating critical workflows with every deployment and maintaining continuous confidence in their customer experience.
Replace the coverage widget on your QA dashboard with a journey health board. For each revenue critical workflow, display the current status: passing or failing, across which environments, as of which deployment.
When your CEO asks "are we ready to release?" the answer should not be "we have 92% coverage." The answer should be: "All seven revenue critical journeys are passing across all target environments as of the 2pm build. The checkout flow has been green for 14 consecutive days. The login journey flagged a regression on Safari mobile after yesterday's deployment, which was automatically identified by AI Root Cause Analysis and resolved within 40 minutes."
That is a confidence report. That is what quality measurement should look like.
The shift from coverage to journey confidence is not just a philosophical improvement. It produces measurable business outcomes because it focuses testing effort where it directly protects revenue.
When testing effort is distributed by coverage percentage, teams often invest heavily in testing low risk areas simply to push the number higher. When testing effort is distributed by journey importance, every hour of QA work is directed at the workflows that matter most to customers and the business.
Enterprise organisations that adopt journey centric testing approaches consistently report transformative results. Teams that previously struggled with less than 20% first time pass rates on critical workflows achieve 83% pass rates. Organisations that required 475 person days per release cycle reduce that to 4.5 days by automating journey validation end to end. Teams that needed 100+ SDETs to maintain brittle script based coverage achieve better outcomes with 50% leaner teams focused on journey level testing.
The mathematics are compelling. According to ITIC, the average cost of a single hour of critical application downtime exceeds $300,000 for enterprise organisations. A broken checkout journey on a high traffic ecommerce site during a peak sales period can generate six or seven figure losses within hours. IBM's Systems Sciences Institute research demonstrates that defects found in production cost up to 100 times more to resolve than those caught during the design phase.
Journey confidence catches these failures before they reach customers. Coverage percentage does not.
The move from coverage to journey confidence is ultimately a mindset shift about what quality means in software. Coverage measures engineering activity. Journey confidence measures customer outcomes. They are fundamentally different concepts, and the one you optimise for determines the quality culture of your organisation.
When you optimise for coverage, teams write tests to push a number higher. When you optimise for journey confidence, teams write tests to protect the customer experience. The first approach produces test suites full of low value assertions that technically execute code but validate nothing meaningful. The second produces focused, high value tests that mirror how real customers actually use the product.
The most advanced QA organisations have already made this shift. They do not report coverage to their leadership. They report journey health. They do not measure quality by how many lines of code were touched by tests. They measure quality by how many critical customer workflows are verified, right now, across every environment.
The tooling now exists to make this practical at enterprise scale. AI native test platforms that author tests at the journey level, maintain them automatically through self healing, execute them across thousands of environments, and diagnose failures with root cause intelligence. What was once a nice theory is now an operational reality.
The only question is whether your organisation will make the shift before a broken journey teaches you why coverage percentage was never enough.


Try Virtuoso QA in Action
See how Virtuoso QA transforms plain English into fully executable tests within seconds.