Blog
Decision Table vs Decision Tree: Key Differences Explained

Abhilash
Published on

Table of contents
Lorem ipsum
Lorem ipsum
Lorem ipsum
Lorem ipsum
Lorem ipsum
Decision tables and decision trees express the same logic in two different shapes. A decision table is a tabular layout of conditions, actions, and rules that enforces combinatorial completeness by construction, while a decision tree is a hierarchical diagram that shows the path through the conditions and makes the flow visible at a glance.
Tables are stronger for verification and audit because no combination can hide, and trees are stronger for communication and design because the logic reads like a story.
A serious practitioner uses both, knows when to reach for each, and treats them as specification artefacts that feed behaviour-led test automation rather than as substitutes for it.
The Flowchart That Passed Every Review
Consider a pattern audit teams in property and casualty insurance will recognise. A regulatory inspection of a mid-sized insurer surfaces an unusual failure, where the claims approval engine has been processing certain edge-case combinations incorrectly for fourteen months. Not a code defect, but a logic gap.
The rules that determine whether a claim should be auto-approved, routed for manual review, or auto-declined live in a flowchart on the engineering wiki. The diagram is elegant, and every reviewer who has ever read it has nodded, but nobody has checked whether the diagram covers every combination of inputs the production system actually receives.
The remediation is not new code. It is a decision table that enumerates every combination of conditions, exposes the three gaps the flowchart had quietly hidden, and produces a test case for each one. Twelve weeks later the engine behaves correctly, and the flowchart, redrawn to match the table, is finally accurate.
The point of the story is the geometry. A flowchart, like its more disciplined cousin the decision tree, tells you what happens on each path it draws, while a decision table tells you what happens on every path that exists.
The first is easier to read. The second is harder to fool.
What is a Decision Table?
A decision table is a tabular representation of conditional logic. It enumerates a set of conditions, a set of actions, and the rules that map combinations of conditions to actions, with the intent of exhaustive coverage of the logic in a single readable grid.
A typical decision table has four quadrants, namely the conditions at the top-left listing the input variables that drive the decision, the condition entries at the top-right giving the value each condition takes in each rule, the actions at the bottom-left listing the outputs the system may produce, and the action entries at the bottom-right showing whether each action is triggered for each rule.
Each column on the right side of the table is a rule, and a rule is a complete specification, meaning given these condition values, take these actions.
Related Reads: Decision Table Testing - Guide with Examples, Types, and Best Practices
Two Flavours of Decision Table
Most practitioners encounter two forms. A limited entry decision table restricts condition entries to true or false, which is simple, exhaustive, and easy to verify. An extended entry decision table allows condition entries to take multiple values such as low, medium, or high, which is more compact but requires care in verification because the rule space is no longer a pure binary count.
For N binary conditions, a fully expanded limited entry table has 2^N rules, so four conditions produce sixteen rules and five produce thirty-two.
The growth is exponential, which is both the strength of the technique, since no combination is missed, and its operational challenge, since the table becomes large quickly.
Rule Collapsing
A fully expanded table is exhaustive but often contains redundancy. If a particular condition does not influence the outcome under certain other conditions, multiple rules produce the same action, and rule collapsing replaces the irrelevant condition with a dash, merges the duplicate rules, and shrinks the table to its informationally distinct cases.
Rule collapsing is not optional housekeeping, it is the technique that makes large decision tables tractable, and done well a table with thirty-two raw rules can compress to six or seven that capture the same logic without loss.

What is a Decision Tree?
A decision tree is a hierarchical graphical representation of conditional logic. It begins at a root node, branches at each internal node based on the value of a condition, and terminates at leaf nodes that specify actions or outcomes.
Every path from the root to a leaf is a complete decision sequence, so reading the tree from top to bottom tells you what happens in that specific scenario, and the structure communicates flow visually in a way that a table does not.
Two Contexts the Term Appears In
The phrase "decision tree" lives in two adjacent worlds that overlap in software engineering and diverge in machine learning, and conflating them is common and avoidable.
In software engineering and testing, a decision tree is a hand-built graphical representation of conditional logic used as a specification or design artefact.
In machine learning, a decision tree is an automatically constructed classification or regression algorithm that partitions data based on information gain or Gini impurity, used for prediction.
The two share the visual shape and almost nothing else, since the first is a deterministic specification drawn by humans and the second is a statistical model learned from data. This page is concerned with the first.
Tree Structure at a Glance
The vocabulary is small and worth nailing down. The root node is the starting decision, usually the most discriminating condition. Internal nodes are intermediate decisions, each splitting on a single condition. Branches are the possible values of each condition. Leaf nodes are the terminal actions or outcomes.
A well-drawn tree places the most discriminating conditions near the root so the tree reads with the fewest decisions per path, while a poorly drawn tree buries the discriminating logic deep, which lengthens every path and obscures the structure.
The Seven Differences That Actually Decide Which to Use
Many comparison pages list ten or fifteen differences and obscure the practical choice. Seven differences cover what matters in a real test design decision.
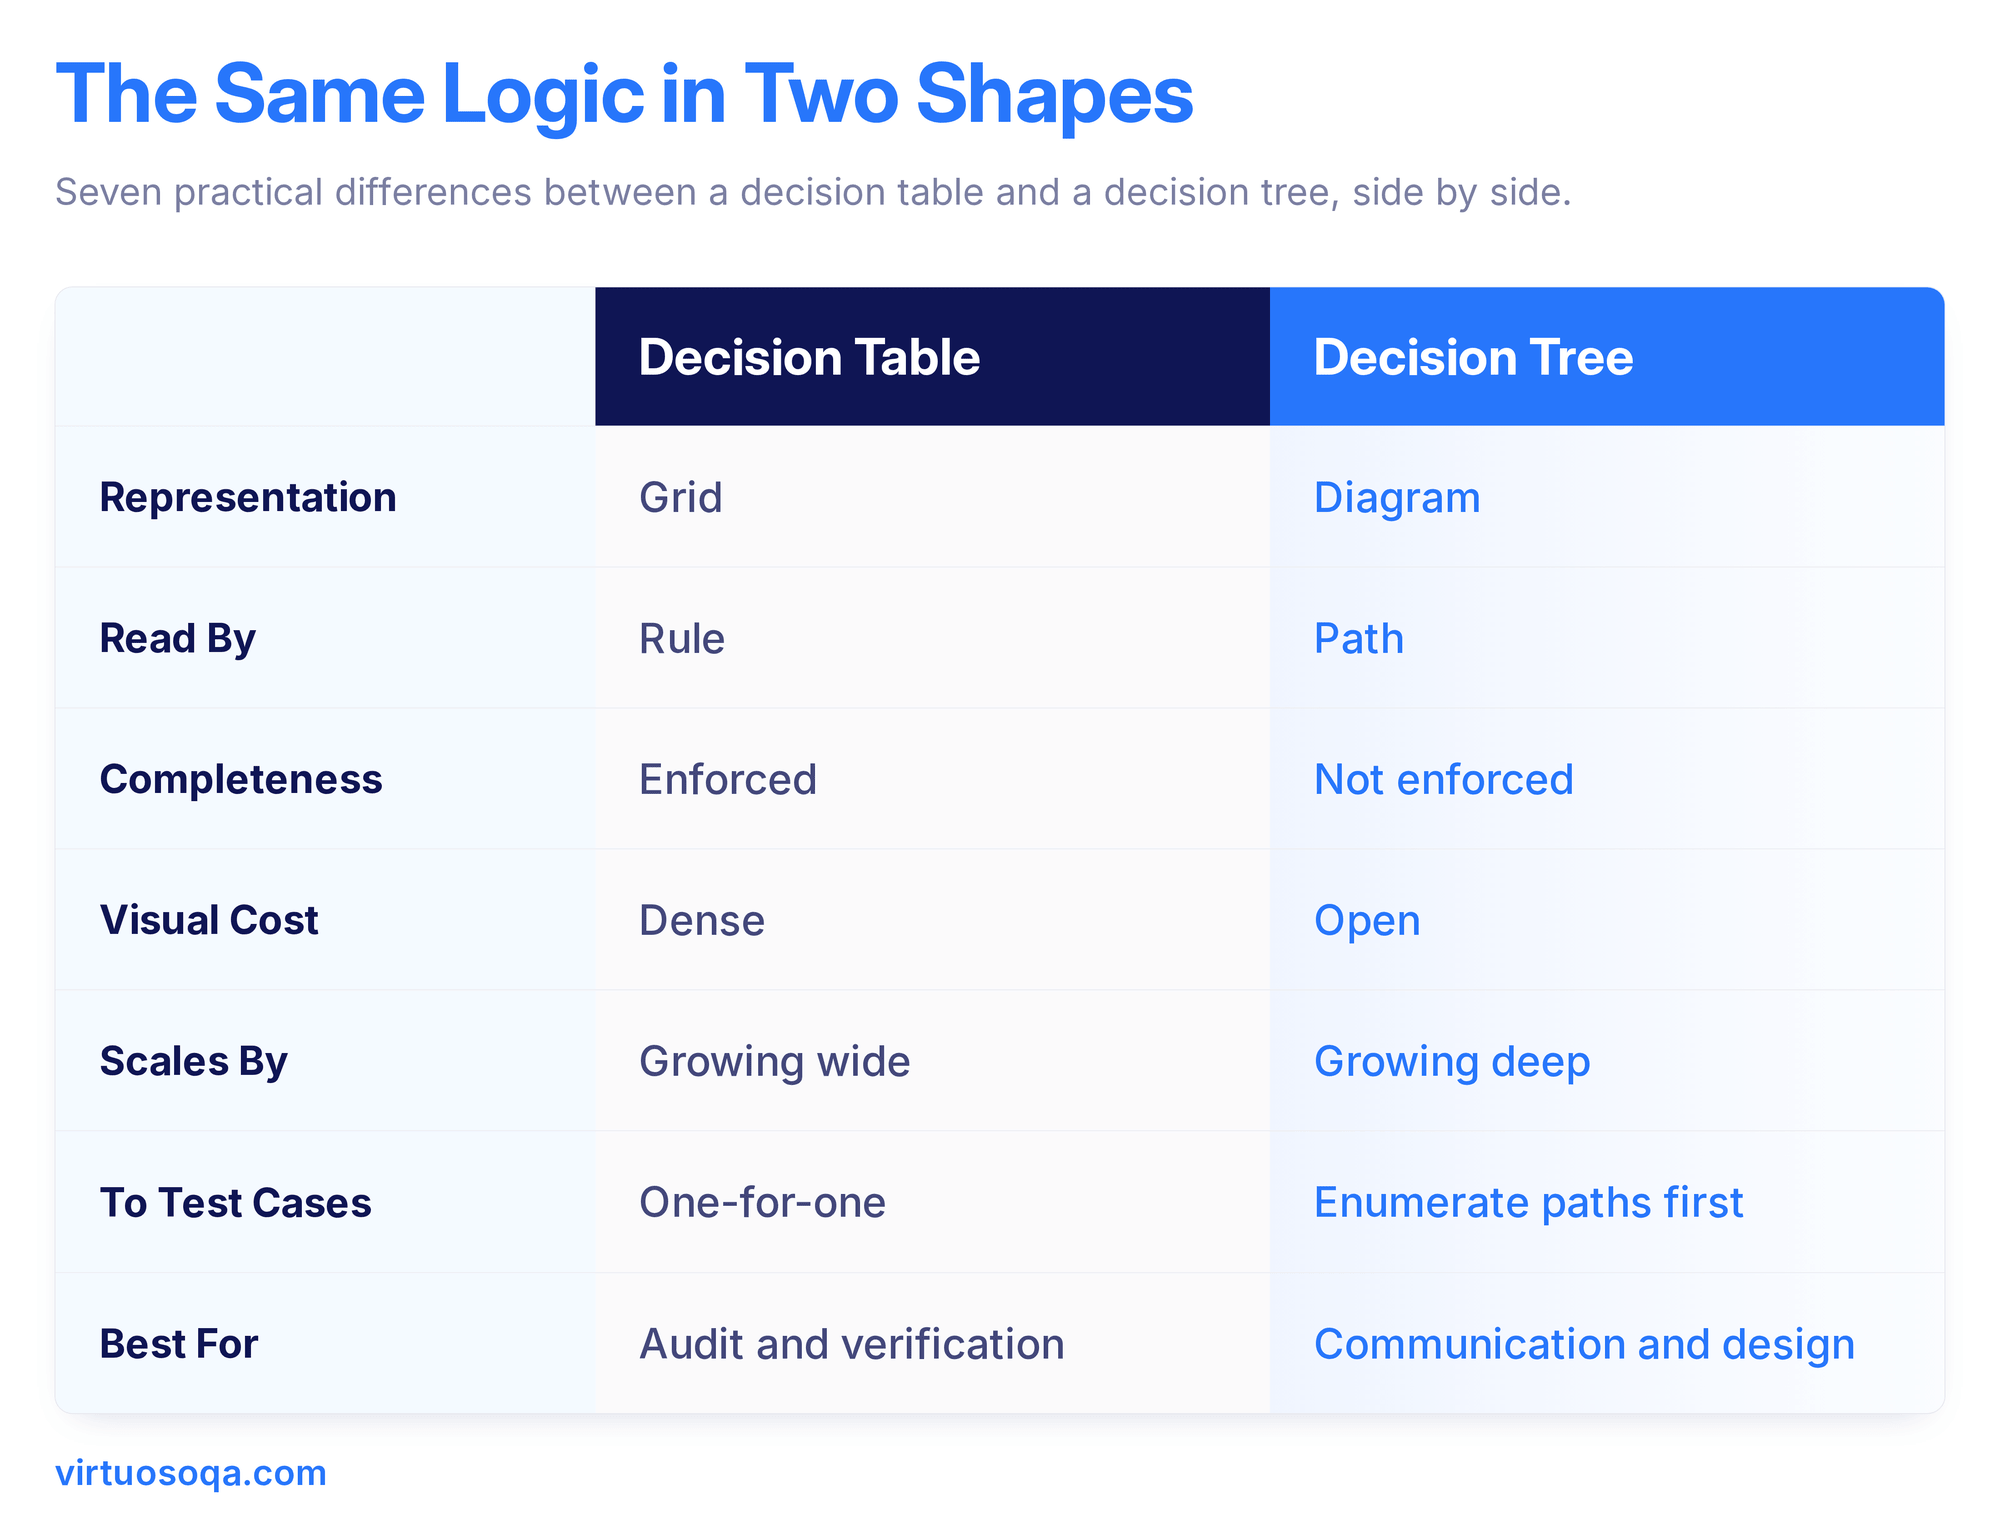
1. Representation
A decision table is a grid, and a decision tree is a diagram. The grid is dense and information-rich, the diagram is sparse and intuitive, so it is the same logic in two shapes with two affordances.
2. How the Logic is Read
A decision table is read by rule, and a decision tree is read by path.
Looking at one column of a table tells you what happens for one combination of inputs, while following one route from root to leaf tells you what happens for one scenario.
A subtler mechanical difference sits underneath this, namely that a decision table evaluates the same set of properties across every column, while a decision tree can evaluate a different property at each branch, which is why tables suit many combinations of the same conditions and trees suit dependent conditions that vary down the path.
3. Completeness
A decision table enforces combinatorial completeness and a decision tree does not.
A fully expanded table with N binary conditions has 2^N rules, every one explicit, so the reviewer can audit the entire decision space by reading down the columns, whereas a tree may omit branches, collapse paths, or leave entire combinations unaddressed if the designer drew it that way.
4. Visual Cost
A decision table is dense and demands attention, while a decision tree is open and invites the eye.
A non-technical stakeholder reading both for the first time will understand a tree before a table, since the tree communicates intent and the table demands inspection, so the choice depends on the audience.
5. Scalability
Both struggle as conditions multiply, in different ways. A table grows wide, from sixteen to thirty-two to sixty-four rules, and the reader can still verify each column but the cognitive load mounts, while a tree grows deep, with each path taking longer to follow and the diagram spreading across multiple pages.
At the same complexity, a table remains auditable longer and a tree remains communicable longer.
6. Translation to Test Cases
A decision table maps to test cases one-for-one, since each rule is a test case, while a decision tree requires path enumeration first, since each root-to-leaf path is a test case but the enumeration is a separate step.
For test design, the table is the more direct input.
7. Best fit
Tables fit problems where combinatorial completeness matters, such as claims adjudication, loan approval, tax calculation, regulatory compliance, and access control.
Trees fit problems where flow communication matters, such as customer onboarding, multi-step workflows, troubleshooting flows, and user journey design.
The one-line version to carry away is that decision tables enforce completeness, and decision trees communicate paths.
A Worked Example, Both Techniques Applied to the Same Problem
The same logic, two ways, makes the difference real.
A simple claims engine decides what to do with an incoming claim based on four conditions,
Whether the policy is active (C1)
Whether the claim is within coverage limits (C2)
Whether supporting documentation is complete (C3)
Whether there is no prior fraud flag on the policyholder (C4)
Four actions are possible,
Auto-approve and pay (A1)
Route to manual review (A2)
Request additional documentation (A3)
Reject the claim (A4)
As a Decision Table - Limited Entry, Collapsed
A fully expanded table would have sixteen rules. After collapsing for irrelevant conditions, the practical table reduces to five rules.
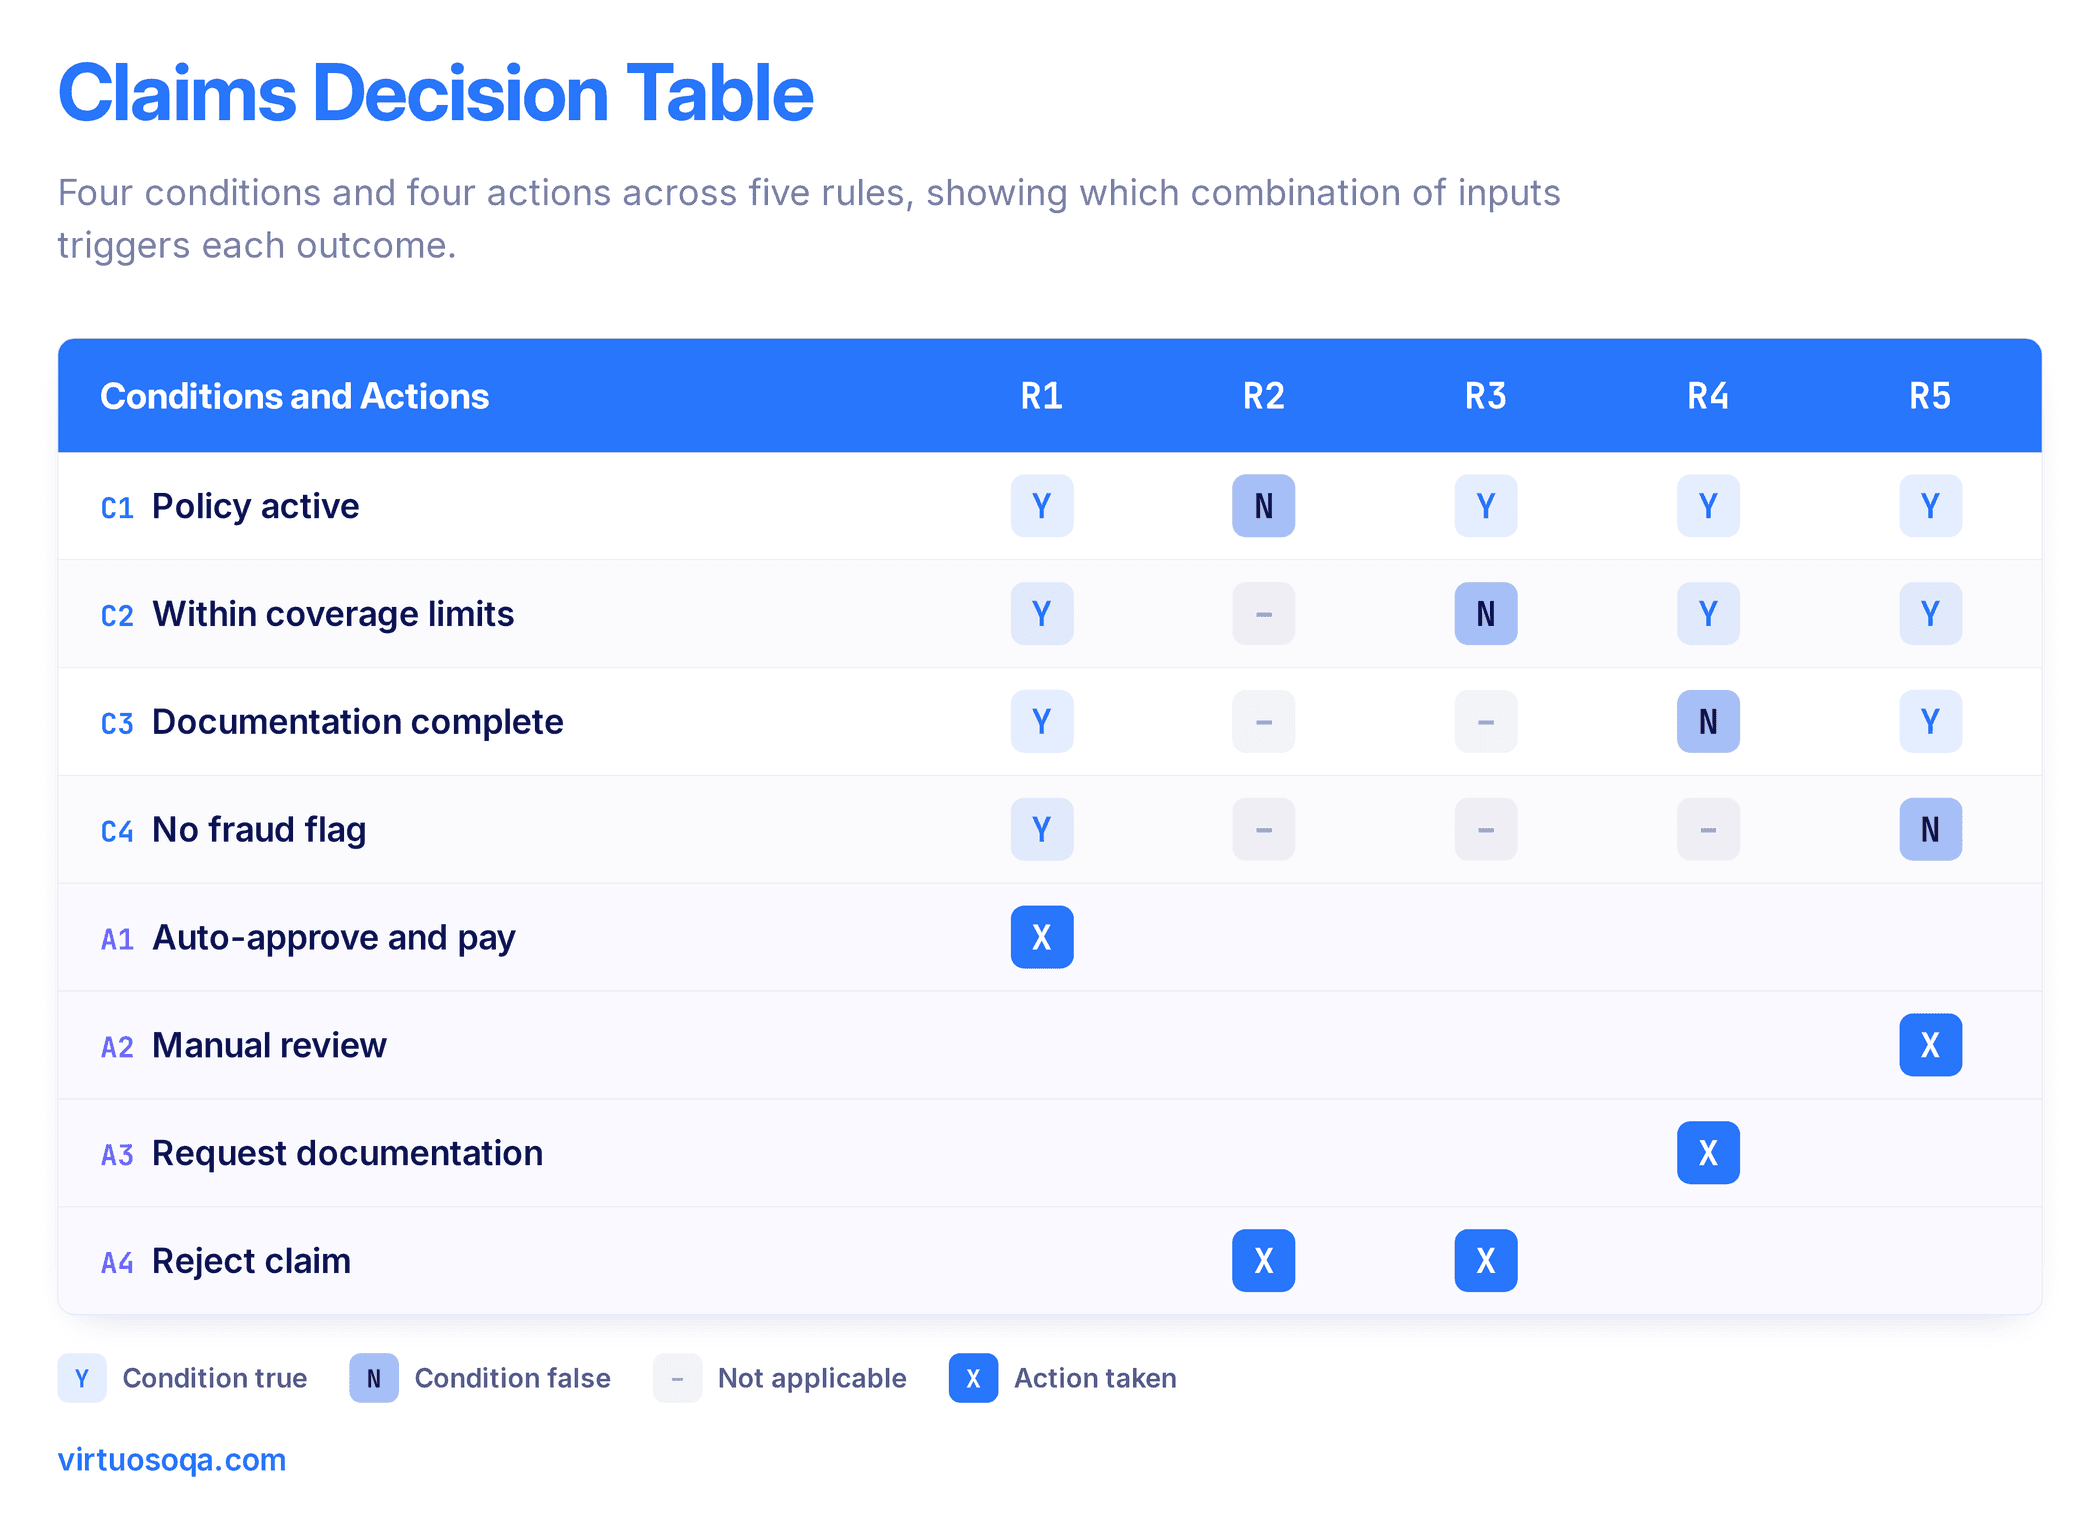
Five rules, four actions, and no combination unaddressed.
R1 covers the happy path where every condition holds.
R2 collapses every situation where the policy is not active into a single reject, since once the policy is inactive the other conditions do not matter.
R3 rejects out-of-coverage claims.
R4 catches incomplete documentation and requests more.
R5 flags fraud risk for human review.
Each rule is a test case, and the dashes are the honest record of which conditions genuinely do not matter once an earlier condition has decided the outcome.
As a Decision Tree
The same logic, redrawn as a hierarchy with the most discriminating condition, policy active, at the root.
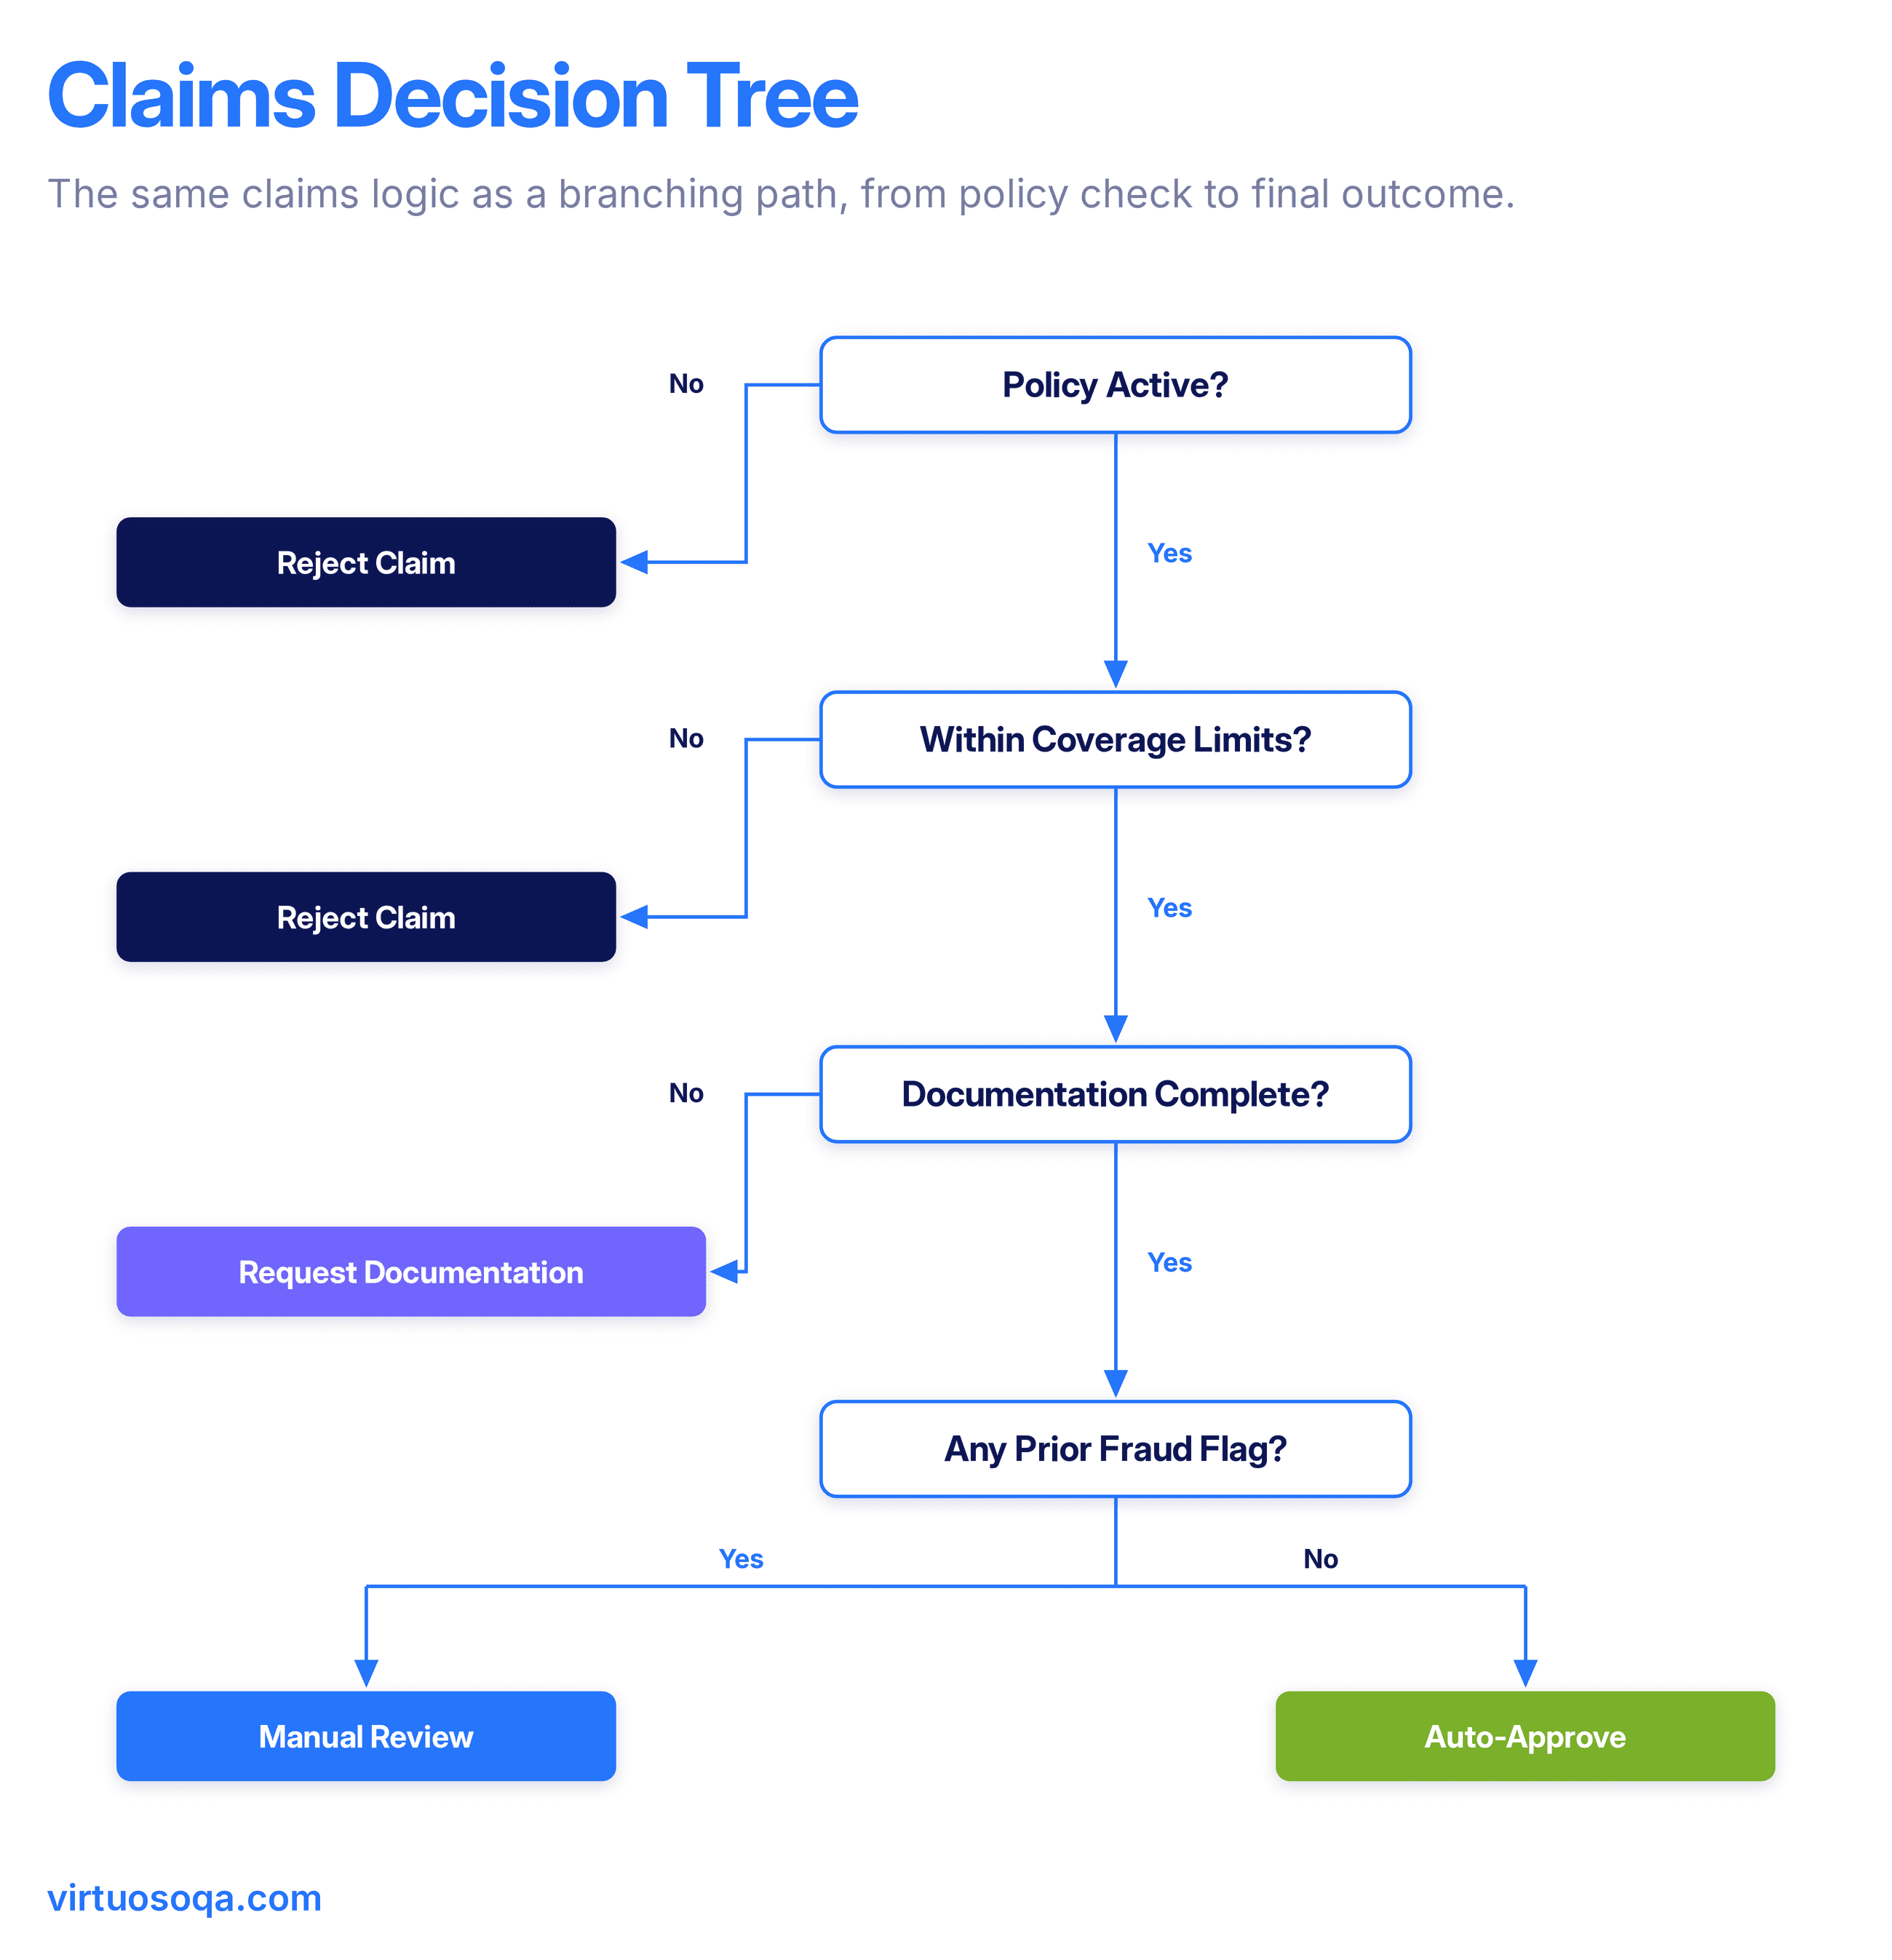
Same logic, different shape. A non-technical reviewer absorbs the tree in seconds, while an auditor verifies the table.
The two artefacts are not in competition, they are two views of the same specification, and mature test design uses both.
Advantages and Limitations of Each Technique
Each technique earns its place for specific reasons and pays specific costs. Naming both keeps the choice honest.
Decision Tables
The advantages are
They enforce completeness by construction so no combination hides
They map one-for-one to test cases
They are auditable by inspection
They communicate complex rules unambiguously
They integrate cleanly with business rules engines
The limitations are
They grow wide quickly as conditions multiply, so large tables need splitting or disciplined collapsing to stay readable
They do not show the sequence or flow of a decision
They demand inspection rather than inviting the eye, which makes them harder for a non-technical audience to absorb at a glance
Decision Trees
The advantages are
They communicate flow visually
They place the most discriminating decisions near the root so the important logic reads first
They are quickly understood by non-technical audiences
They serve well as design and training artefacts
The limitations are
They do not enforce completeness, so a combination can be silently omitted
They grow deep and unwieldy as conditions multiply
They require a separate path-enumeration step before they can be turned into test cases, which makes them a less direct input to test design than a table.
When to Use a Decision Table
Reach for a decision table in these situations.
When the logic has multiple independent conditions and you cannot afford to miss a combination.
When regulatory or audit scrutiny is likely and "we considered every case" needs to be defensible.
When the decision will be implemented as automated logic and converted to test cases directly.
When the number of conditions is small enough for the table to remain auditable, typically up to six or seven binary conditions, and more with rule collapsing.
When the stakeholders include reviewers, auditors, or testers who need to verify completeness.
Decision tables are the test designer's default for combinatorial logic, and the discipline scales further than people expect once rule collapsing is practised honestly.
When to Use a Decision Tree
Reach for a decision tree in these situations.
When the audience includes non-technical stakeholders who need to grasp the flow quickly.
When the logic is naturally sequential, with each decision narrowing the set of remaining possibilities.
When a subset of conditions is genuinely more important than the rest, and the tree's hierarchy mirrors that priority.
When the artefact will be used for design discussion or training rather than verification.
When the flow needs to be communicated in a single visual a reader can absorb without studying.
Decision trees are the communication tool, and they earn their place in product design conversations, customer journey reviews, and onboarding documentation.

How They Connect to Modern Test Automation
Decision tables and decision trees are specification artefacts. They describe the logic the system is meant to follow, but they do not verify the logic the system actually follows, and the gap between the two is where most production incidents live. Three practical connections matter.
Specifications feed test generation rather than replacing it. A decision table converts cleanly into a set of test cases, one per rule, and the conversion is the cheap part, while the hard part is verifying that the system in production behaves the way the table specifies.
Specifications drift, and tests should not. The flowchart in the opening scene was wrong because it stopped tracking what the system did, and the lesson generalises, since a decision table that has not been validated against the running system in the last quarter is a hypothesis rather than a fact, and continuous verification is what turns a hypothesis into a confidence claim.
The behaviour layer absorbs implementation change. Decision logic implemented in code today may be reimplemented in a different module, framework, or service tomorrow, particularly in AI-accelerated codebases, and tests that bind to the implementation break with every refactor, while tests that bind to the specification, the rules in the table or the paths in the tree, survive the refactor because the specification is what the customer experiences.
Common Pitfalls
Five mistakes show up repeatedly in practitioner reviews.
Drawing the tree before checking the table: A tree drawn from intuition often omits combinations the designer did not anticipate, so building the table first and drawing the tree from it prevents the omission. The discipline costs an hour and saves a quarter.
Collapsing rules too aggressively: Rule collapsing removes irrelevant conditions, and the trap is marking a condition as irrelevant when it merely appears irrelevant in the cases the designer happened to think of, so each dash should defensibly answer why the condition does not matter here.
Treating the artefact as a substitute for verification: A complete decision table is a specification, not a guarantee, since the system may diverge from it in production, and the artefact becomes a confidence claim only once the rules have been executed against the live system.
Confusing the drawn tree with the machine learning algorithm: A drawn decision tree used as a specification is editorial, while a learned decision tree used as a classifier is statistical, and conflating the two leads to expectations the artefact cannot meet.
Letting the table or tree go stale: Both decay if not maintained, and a table or tree that no longer matches the running system is worse than none, so living specifications kept aligned with observed behaviour are the only ones worth trusting.
How Virtuoso QA Approaches Decision Logic
Three design decisions in Virtuoso QA bear on how decision tables and trees feed into modern test automation.
Plain-English authoring at the workflow level, which means a decision table can be translated into executable tests as readable English without intermediate code, so a rule that says "if the policy is active, the claim is within coverage, and the documentation is complete, then auto-approve" is the test rather than a separate artefact.
Composable test modules, which let common sub-flows be reused across rules, so the "check policy is active" module is built once and reused in every test that depends on it, and a decision table with twenty rules does not require twenty independent scripts.
Self-healing, which absorbs implementation drift, so when the underlying claims engine is refactored, the workflow-level tests continue to verify the rules and the specification remains the source of truth.
The result is a practice in which decision tables and trees stop being documents on a wiki and start being executable specifications the system is continuously verified against.

Frequently Asked Questions
What is the Main Difference Between a Decision Table and a Decision Tree?
Which is Better, a Decision Tree or a Decision Table?
When Should I Use a Decision Table Over a Decision Tree?
How Do I Convert a Decision Table to a Decision Tree?
How Do Decision Tables Relate to Test Automation?
What is Rule Collapsing in a Decision Table?