
Blog
What is a Test Report: Components, Metrics & Templates Guide

Published on
March 3, 2026


Learn how to create test reports that drive release decisions. Cover essential components, key metrics, templates, and how AI transforms reporting into insight.
A test report that nobody reads is a test report that failed before it was written.
Most QA teams create test reports because process says they should. The document gets assembled, circulated, skimmed, and filed. Meanwhile, release decisions are made on gut feel, defects escape to production, and stakeholders remain uncertain whether the software is actually ready to ship.
The problem is not that teams lack data. It is that traditional test reports present data without insight. A spreadsheet showing 847 passed and 23 failed tests tells leadership nothing about risk. It does not reveal whether those 23 failures affect a critical payment flow or an obscure settings page. It does not indicate whether failures are trending upward across releases or represent isolated regressions. It does not answer the question every stakeholder actually has: "Can we ship this safely?"
This guide redefines what a test report should be. Not a compliance artifact. Not a status update. A decision making instrument that translates testing data into business intelligence, accelerates release confidence, and continuously improves the quality engineering practice. And in 2026, with AI transforming how failures are analyzed, how root causes are identified, and how coverage is visualized, the gap between traditional reporting and intelligent reporting has never been wider.
A test report is a structured document that summarizes the outcomes, findings, and insights from a testing effort. It communicates what was tested, what passed, what failed, why it failed, what risks remain, and what actions are recommended before release.
At its core, a test report answers three questions for its audience. First, what is the current quality state of the software? Second, does the quality level meet the criteria required for release? Third, what specific risks or defects require attention before the software reaches users?
A well constructed test report serves multiple audiences simultaneously. QA managers use it to track testing progress and team productivity. Development leads use it to prioritize defect resolution. Product owners use it to assess whether release timelines are achievable. Engineering directors use it to understand quality trends across releases. Executives use it to make go or no go decisions based on quantified risk rather than optimistic assumptions.
The format varies from a one page summary for a sprint demo to a comprehensive multi section document for a major release, but the purpose is constant: turn raw testing data into actionable intelligence.
Test reports are not administrative overhead. When done correctly, they are among the most valuable artifacts a QA organization produces.
Software quality is not a QA concern alone. Developers need to know where defects cluster. Product managers need to know which features are validated and which carry risk. Leadership needs to know whether deployment timelines are realistic. Test reports make quality visible to everyone who influences the release.
Without reporting, release decisions default to opinions: "I think it is ready," "It seems stable," "We have not heard of any issues." Test reports replace assumptions with evidence. Pass rates, defect densities, severity distributions, and coverage metrics give decision makers the quantified basis they need.
Test reports reveal whether the QA effort is working. If defect escape rates are rising across releases, the testing strategy needs adjustment. If automation coverage is stagnant while the application grows, investment is needed. Without measurement, improvement is guesswork.
Regulated industries including financial services, healthcare, insurance, and government require documented evidence that software has been tested to specified standards. Test reports serve as audit artifacts that demonstrate due diligence in quality assurance. In environments governed by FDA, HIPAA, SOX, or PCI DSS, comprehensive test reporting is not optional.
The test plan defines what will be tested, when, and with what resources. The test report reflects what actually happened. Comparing the two reveals execution gaps, resource constraints, and scope changes that inform future planning.
Test reports align with the Software Testing Life Cycle (STLC) and should be generated at specific milestones.
In agile environments, a brief test summary at the end of each sprint communicates what was validated, what defects were found, and what carries forward. This keeps stakeholders informed without waiting until the end of a release.
System testing, integration testing, regression testing, and user acceptance testing each produce reports that summarize their specific scope and findings. Phase level reports allow teams to assess readiness at each quality gate before proceeding.
The most critical test report is the one that informs the go or no go decision. This report consolidates findings from all testing phases, presents the overall quality posture, and explicitly identifies remaining risks with their potential business impact.
Executives, auditors, or project sponsors may request test reports at any time. The ability to generate accurate, up to date reports on demand requires either diligent manual tracking or automated reporting infrastructure.
When defects reach production, a post incident test report documents what was tested, what was missed, and what changes to the testing strategy will prevent recurrence. This closes the feedback loop between production quality and test coverage.

A comprehensive test report includes the following sections, each serving a specific purpose for its audience.
Start with context. Identify the project, the software version under test, the testing scope, and the objectives of the testing effort. State the test environment configuration (operating systems, browsers, databases, and third party integrations). This section ensures every reader understands what was tested and under what conditions.
The executive summary is the most read section of any test report. For many stakeholders, it is the only section they read. It must communicate the quality verdict in three to five sentences: the total scope of testing, the overall pass rate, the number and severity of open defects, and the explicit recommendation (ready to release, release with known risks, or not ready for release).
Write the executive summary for someone who has 90 seconds to make a decision. If they read nothing else, they should know the quality state of the software.
Quantify the testing effort. Report the total number of test cases planned, executed, passed, failed, blocked, and not executed. Break these numbers down by test type (functional, regression, integration, performance, security) and by feature area or module. This section reveals both the breadth of coverage and the areas where testing was incomplete.
Catalog the defects discovered during testing. For each defect, report the severity (critical, high, medium, low), the priority (must fix, should fix, could fix, won't fix), the current status (open, in progress, resolved, verified, closed), and the module or feature affected. Aggregate defect data to show trends: total defects by severity, defect density per module, defect discovery rate over time, and defect closure rate relative to discovery.
This section should answer: how many defects exist, how severe are they, which areas of the application are most affected, and are defects being resolved faster than they are being found?
Coverage data demonstrates the breadth and depth of testing relative to requirements. Report requirement coverage (percentage of requirements with associated test cases), code coverage if available (percentage of code paths exercised by tests), and functional coverage (percentage of features validated).
Coverage gaps are as important as coverage achievements. Explicitly identify any requirements, modules, or features that were not tested and explain why (time constraints, environment unavailability, blocked dependencies). This honesty prevents the false confidence that comes from a high pass rate on an incomplete test scope.
Every test report should include a risk assessment that identifies the residual risks the release carries. For each unresolved defect and untested area, assess the probability of user impact and the severity of that impact. Present risks in a format that enables prioritized decision making: critical risks that could block release, high risks that require mitigation plans, and accepted risks with documented justification.
This section transforms the test report from a retrospective document into a forward looking decision tool.
Document the exact test environment configuration, including operating system versions, browser versions, database versions, application build numbers, and any third party service endpoints used during testing. This enables reproducibility: if a defect is disputed or needs re verification, the team can reconstruct the exact conditions under which testing occurred.
Close the report with explicit recommendations. State whether the software meets the quality criteria for release. Identify defects that must be resolved before deployment. Recommend any additional testing that should be performed. Suggest process improvements based on observations from the current testing cycle.
Metrics transform subjective quality assessments into objective measurements. The following testing metrics belong in every test report.
Traditional test reporting is a manual, retrospective process. Testers execute tests, record results in spreadsheets, compile metrics, and assemble the report document. By the time it is circulated, the data is already stale and the context that produced it is fading from memory.
AI transforms test reporting from a static post mortem into a continuous, intelligent, and predictive capability.
When a test fails, the most time consuming task is determining why. Was it an application defect? A test environment issue? A test data problem? A timing or synchronization error? Traditionally, a tester must investigate each failure manually, examining logs, screenshots, and application state to identify the cause.
AI powered root cause analysis automates this investigation. By analyzing test step outputs, network events, failure reasons, error codes, DOM snapshots, and performance metrics simultaneously, AI models identify the most probable cause of each failure and provide an automated diagnosis. Virtuoso QA's AI Root Cause Analysis takes in these multiple inputs and produces actionable explanations that dramatically reduce triage time, enabling QA teams to spend less time investigating failures and more time improving quality.
Static reports capture a point in time snapshot. Dashboards display live data that updates with every test execution. Modern reporting platforms provide real time visibility into pass rates, failure trends, coverage progress, and defect status without waiting for someone to compile a document.
Comprehensive dashboards and detailed reports show test execution status across the entire test suite, with drill down capability from summary metrics to individual test steps. This means a QA manager can see the overall health of a release in seconds, then navigate directly to the specific failure details that require attention.
Not all test failures are equal, but traditional reports treat them that way. A failure caused by a genuine application bug and a failure caused by a flaky test environment appear identical in a pass/fail spreadsheet. AI classifies failures by their root cause category, separating genuine defects from environmental noise, timing issues, and test data problems. This classification instantly focuses development attention on real bugs rather than wasting cycles investigating false positives.
AI enables predictive reporting that traditional approaches cannot achieve. By analyzing defect trends, code change velocity, test coverage patterns, and historical data across releases, AI models predict which areas of the application are most likely to contain undiscovered defects. These predictions allow QA teams to focus exploratory testing and additional automation on the highest risk areas, improving defect detection before release.
AI eliminates the manual assembly of test reports. Rather than a tester spending hours compiling results from multiple sources into a document, AI driven platforms generate comprehensive reports automatically in PDF, Excel, or CSV formats with step by step evidence including screenshots, logs, and network traces. This shifts reporting from a time consuming deliverable into an automatic byproduct of test execution.
Test reports are only as meaningful as the scenarios they cover. If testing runs on the same recycled datasets every cycle, reports reflect a narrow slice of reality while edge cases and boundary conditions stay invisible.
AI powered test data generation changes this. Large language models produce realistic, context aware data on demand through natural language prompts. Instead of manually building CSV files, testers describe what they need in plain English and the data appears instantly.

Different audiences and contexts require different report formats. The most effective QA teams maintain templates for each.
Designed for agile sprint reviews, this brief format covers testing scope for the sprint, total tests executed with pass/fail breakdown, new defects discovered with severity, defect carryover from previous sprints, and a one paragraph quality assessment. Length: one page.
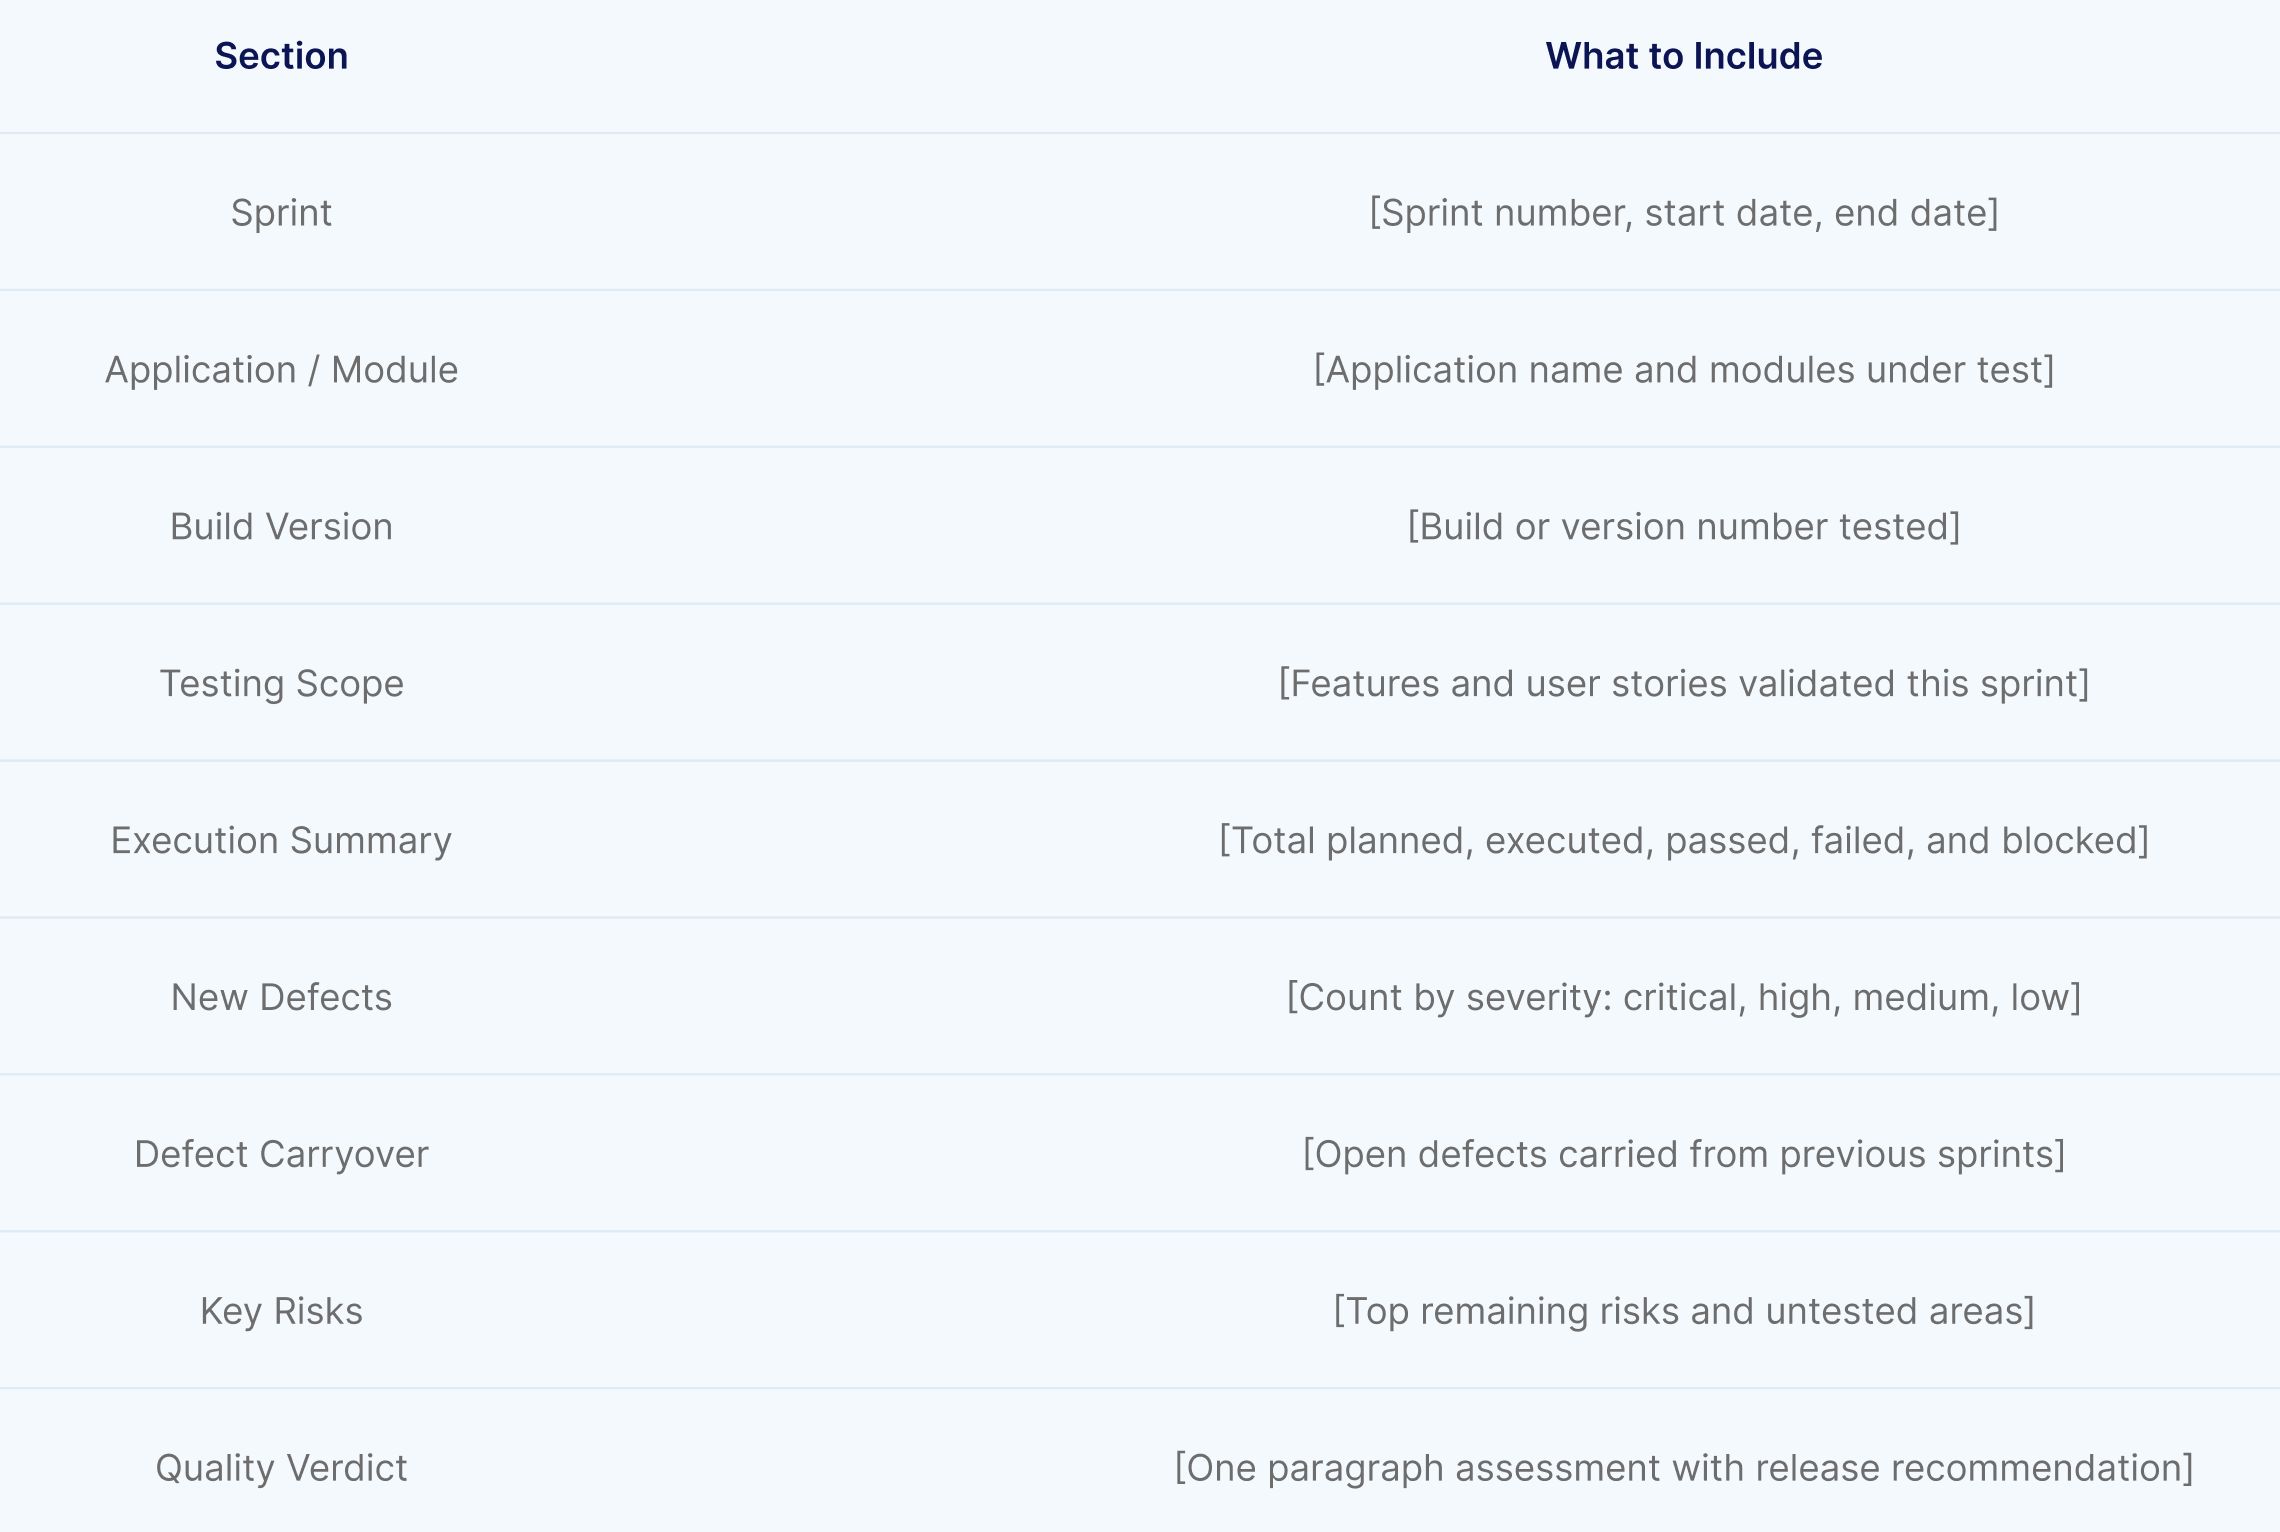
Virtuoso QA generates sprint level reports automatically in PDF, Excel, and CSV formats with step by step evidence. No manual compilation required.
The comprehensive format for release decisions. Includes all sections described above: project overview, executive summary, execution summary, defect analysis, coverage analysis, risk assessment, environment details, and recommendations. This is the document that informs go or no go decisions for production deployment. Length: five to ten pages depending on release complexity.
Quantify the testing effort by test type. This table gives stakeholders an instant view of how much testing was completed and where gaps remain.
.jpg)
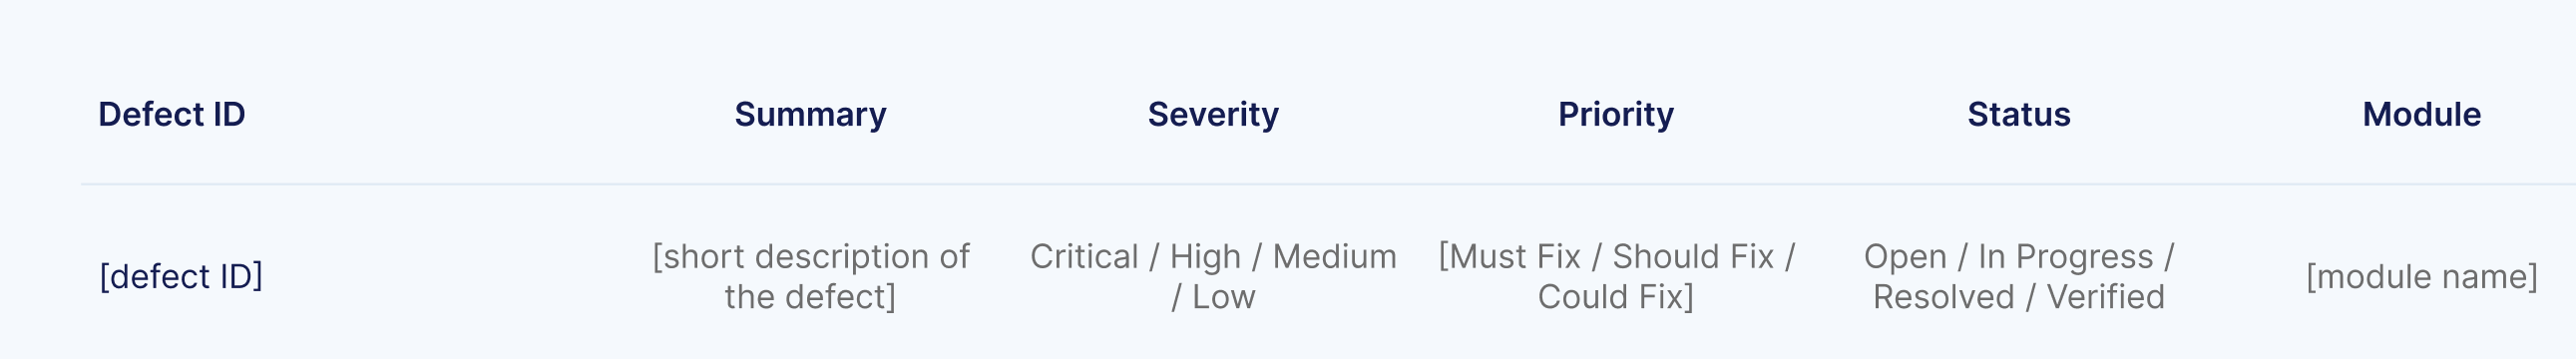
Catalog every defect with its severity, priority, status, and affected module. Aggregate the data below the table to show total defects by severity, defect density per module, and discovery rate vs. closure rate.
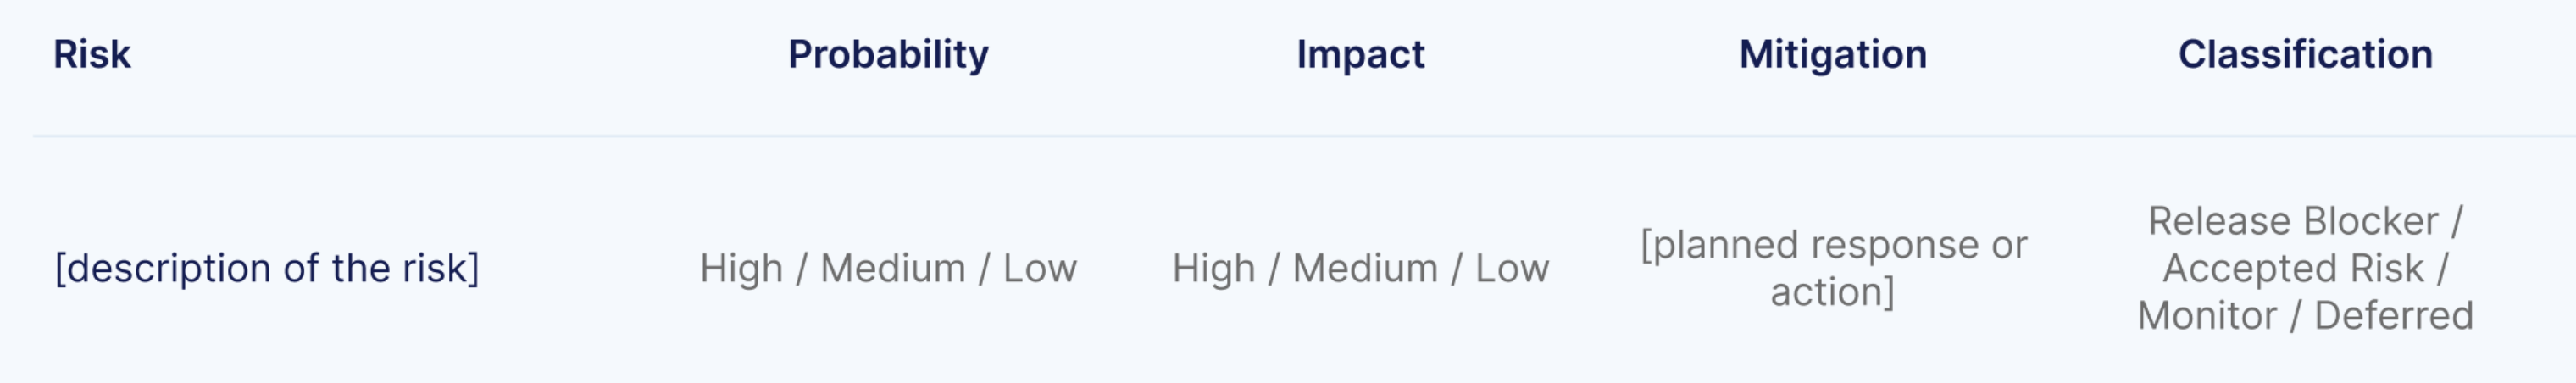
Identify residual risks the release carries. For each unresolved defect and untested area, assess probability and impact so decision makers can prioritise.
Virtuoso's AI Root Cause Analysis enriches every failure with automated diagnosis analysing test steps, network requests, failure reasons, error codes, and UI comparisons.
Focused on regression testing outcomes, this format compares current regression results against the previous baseline. It highlights new failures (potential regressions), resolved failures (confirmed fixes), and stability metrics across releases. Trend visualization is particularly valuable here to show whether quality is improving, stable, or degrading over time.

Virtuoso QA's self healing ensures regression suite stability across releases, so failures in the report represent genuine regressions, not broken automation.
Required for regulated industries, this format maps test results to specific compliance requirements (HIPAA controls, PCI DSS requirements, SOX controls, FDA 21 CFR Part 11). Each compliance requirement is listed with its associated test cases, execution results, and any deviations or exceptions that require remediation.
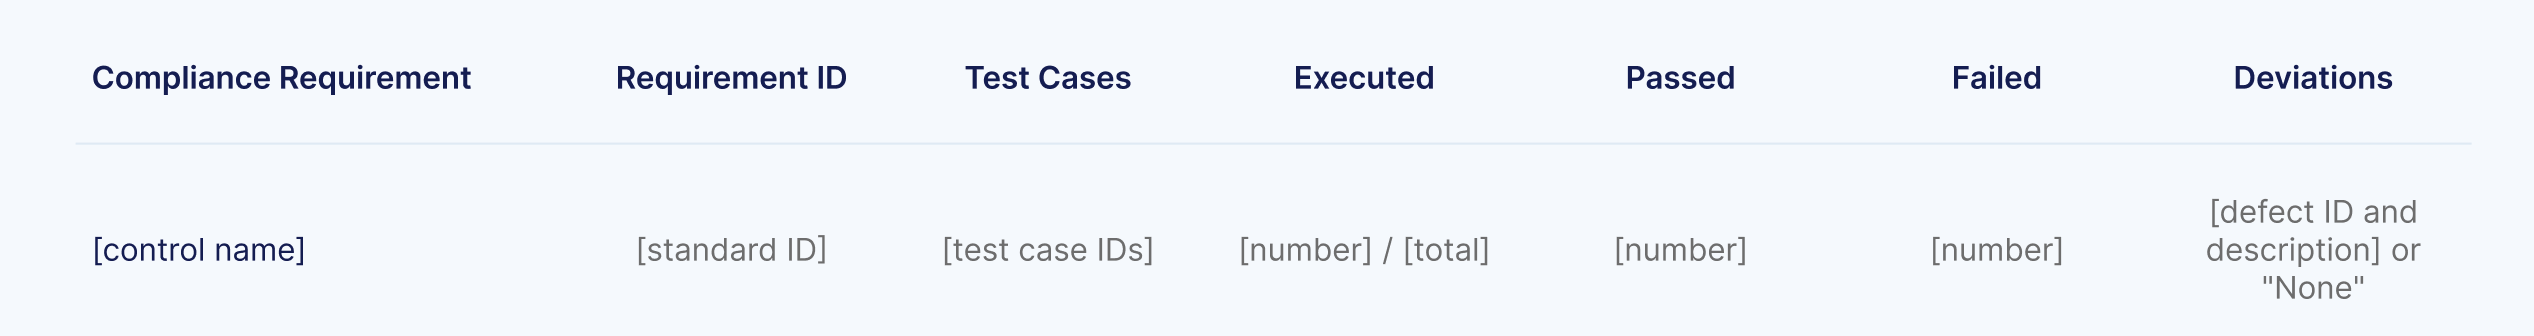
Virtuoso QA's built in requirement coverage tracking maps tests to requirements for full traceability, making it straightforward to populate compliance sections without manual effort.
Not a document but a live interface, the executive dashboard presents real time quality metrics at a glance: overall pass rate, critical defects open, automation coverage percentage, defect trend over the last five releases, and a risk summary. This format serves executives who need continuous visibility without reading reports.

Virtuoso QA's real time dashboards are built in, providing live quality metrics that refresh with every test execution.
Before assembling data, clarify who will read the report and what decisions it must support. A sprint demo summary for the development team requires different content, detail, and tone than a compliance report for an external auditor. Audience determines structure.
Gather test execution results, defect records, coverage data, and environment details from your test management and automation platforms. Validate accuracy: reconcile execution counts, verify defect statuses, and confirm coverage calculations. A report built on inaccurate data undermines trust in the entire QA function.
The difference between a mediocre report and a valuable one is analysis. Do not simply list numbers. Interpret them. If the pass rate dropped 4% from the previous release, explain why. If defect density is concentrated in one module, state the implication. If coverage is incomplete in a high risk area, quantify the risk.
Charts, graphs, and visual indicators communicate faster than tables. Use trend lines to show quality trajectory across releases. Use heat maps to show defect concentration by module. Use pie charts to show severity distribution. Use traffic light indicators (green, amber, red) for at a glance status. Visualizations do not replace analysis, they amplify it.
Every test report should end with a clear recommendation. "Release is recommended with the following known risks" is actionable. "Testing is complete" is not. Your recommendation should include conditions: "Release is recommended provided the two critical defects in the payment module are resolved and verified."
A report that is not read is a report that does not exist. Distribute to all stakeholders through their preferred channels: email, Slack integration, Jira dashboard, or embedded in the CI/CD pipeline results. Follow up on recommendations in subsequent sprints. Track whether recommended actions were taken and whether they produced the expected quality improvement.
A table showing 847 passed and 23 failed tells leadership nothing. Which failures matter? Are they in the payment flow or the settings page? Every number needs context.
A high pass rate on a small scope creates false confidence. If 200 tests pass but 400 requirements exist, half the application is unvalidated. Strong reports call out what was not tested with the same rigour as what was.
Engineers need reproduction steps. Executives need a verdict and three risks. One report for both audiences fails both. Use layered structure: executive summary at the top, detail on demand below.
A 95% pass rate means nothing in isolation. That same number trending down from 98% tells a story of declining quality. Every metric should include a trend line across at least three to five releases.
A genuine bug and a flaky test look identical in a spreadsheet. AI native platforms like Virtuoso QA solve this through intelligent failure classification and self healing, ensuring every reported failure is worth investigating.
A report delivered three days after testing is a historical document. Automated generation and live dashboards replace the compile and send cycle entirely.
Reports that identify problems but never track resolution create documented decline. Every recommendation should be traceable to a resolution in a subsequent report.
In continuous integration and continuous delivery environments, test reporting is not an end of phase activity. It is an integrated, automated component of every build and deployment.
Modern test automation platforms integrate with CI/CD tools including Jenkins, Azure DevOps, GitHub Actions, GitLab CI, CircleCI, and Bamboo to trigger test execution automatically and publish results directly into the pipeline interface. Test outcomes gate the deployment: if critical tests fail, the pipeline halts and the relevant teams are notified immediately.
This integration transforms reporting from a periodic review into continuous quality feedback. Developers see test results within minutes of committing code. QA managers monitor quality trends across every build. Release managers have real time visibility into whether the current build meets deployment criteria. The report is not a document someone writes at the end. It is a living data stream that flows through every stage of delivery.
Executives need the summary. Developers need the detail. Design reports with layered information: summary at the top, detail on demand below. Never force a VP to read 10 pages of test step logs to find the release recommendation.
A 98% pass rate means nothing if the 2% that failed includes the authentication system. Always contextualize results with business impact. Translate technical failures into business language: "The payment processing flow failed under concurrent load" is more meaningful to leadership than "TC_4537 failed on step 12."
A single release report provides a point in time view. Trending metrics across releases reveals trajectory. Is quality improving? Is automation coverage growing? Is defect leakage declining? Trajectory matters more than any individual data point.
Every hour a tester spends compiling a report is an hour not spent testing. Use platforms that generate reports automatically from execution data, with AI providing analysis and classification that would take humans significantly longer.
Stakeholders should not wait for someone to compile and send a report. Dashboards and pipeline integrations provide continuous visibility that replaces the request and wait cycle with self service access.
Test reports that identify problems but never track resolution create a cycle of documented decline. Every recommendation should be tracked to completion in subsequent reports. This accountability mechanism ensures reporting drives improvement rather than documenting deterioration.


Try Virtuoso QA in Action
See how Virtuoso QA transforms plain English into fully executable tests within seconds.